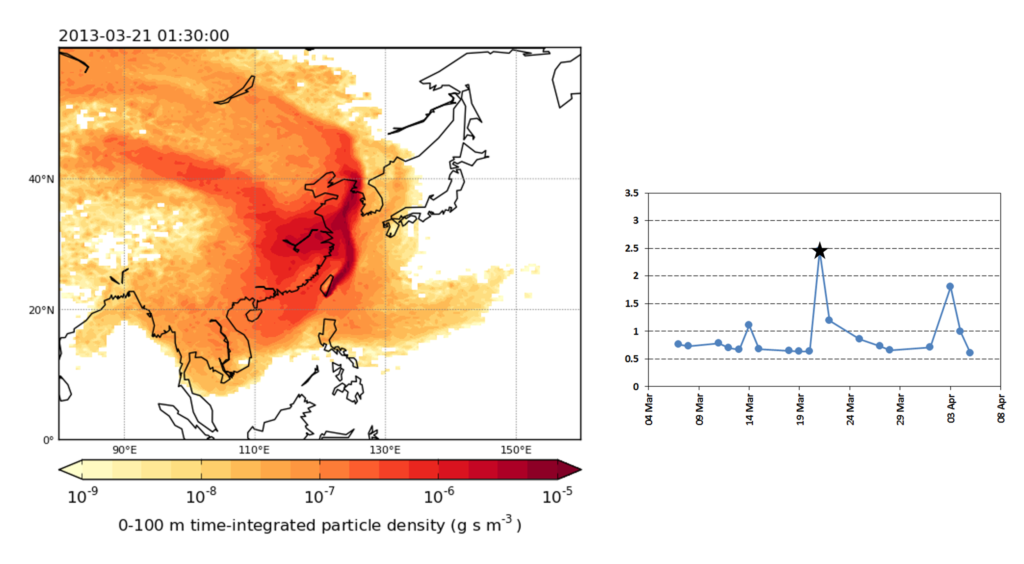
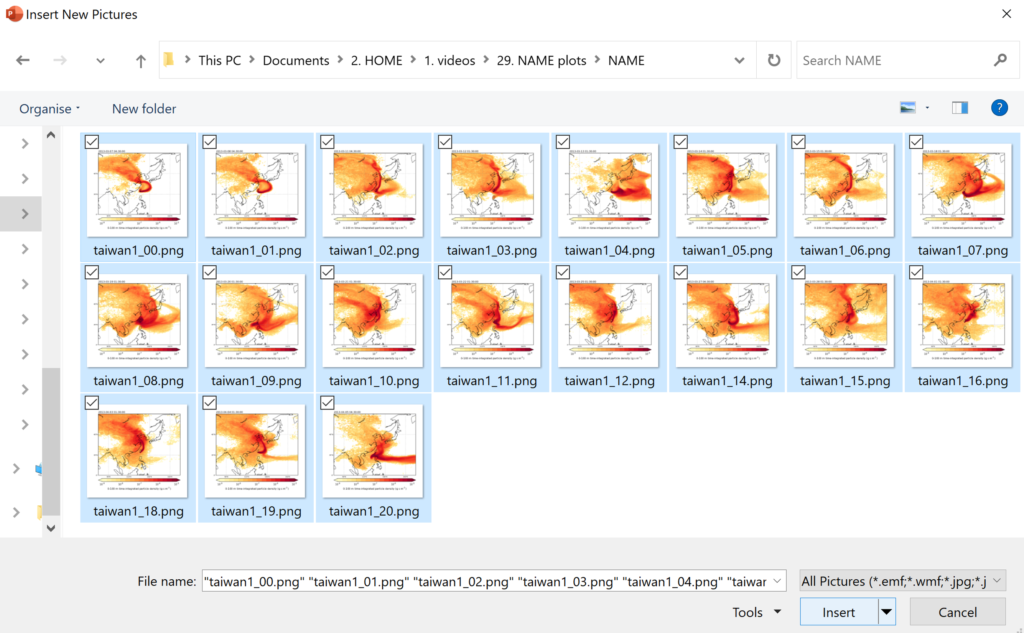
In this example, I have atmospheric transport footprints for days when atmospheric concentrations were measured and I want to look at where the air was coming from when higher concentrations were measured.
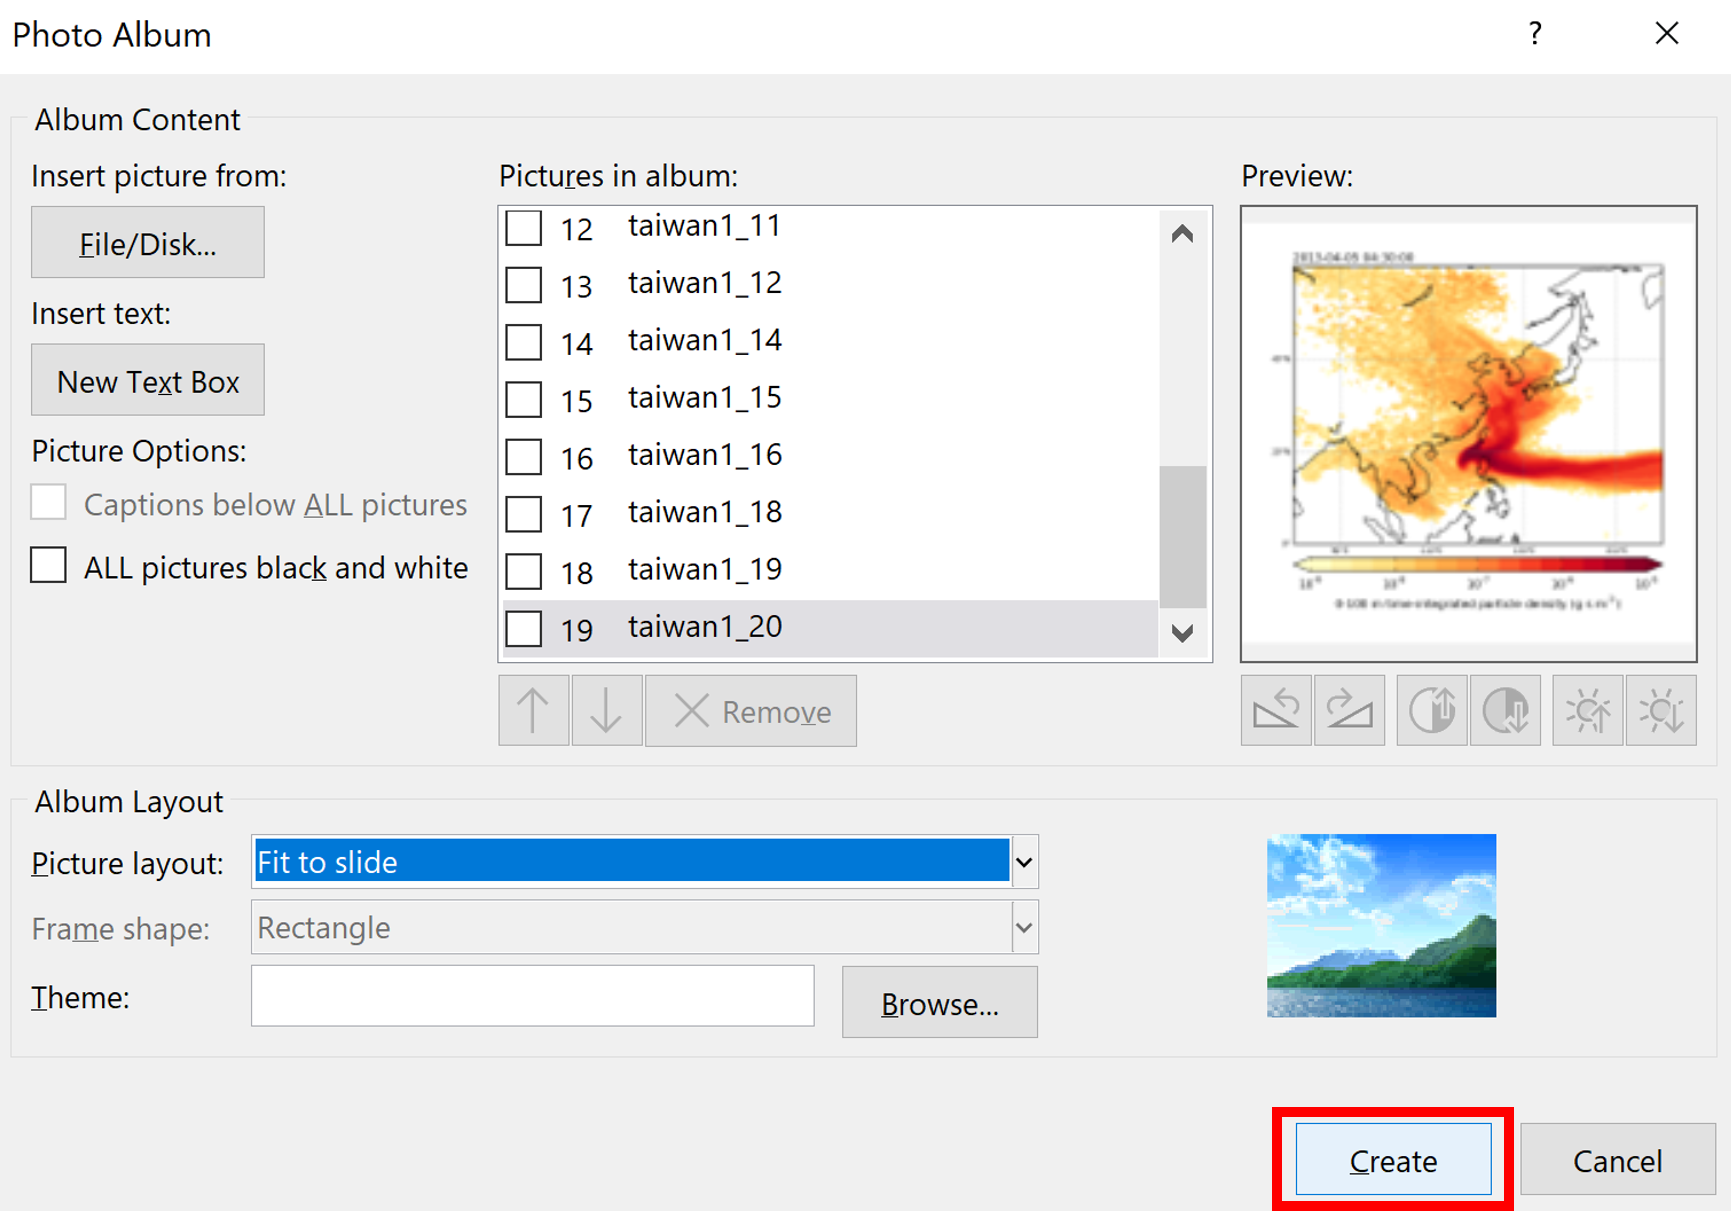
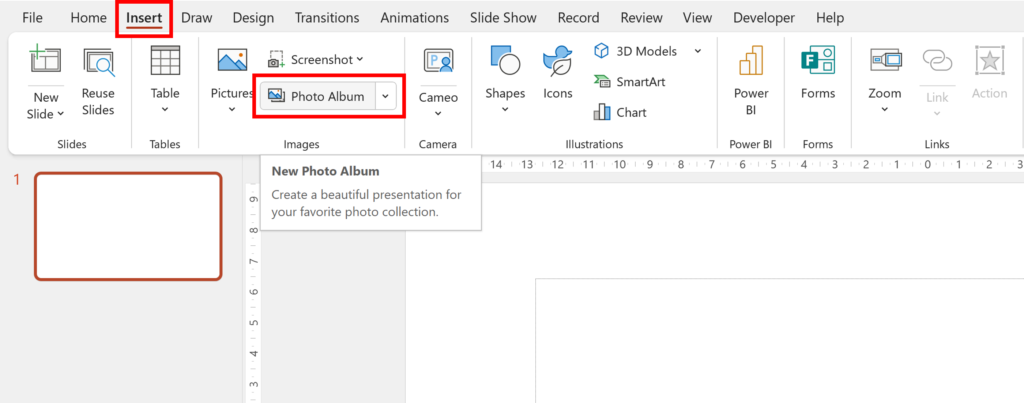
Firstly, go to the Insert Tab and select Photo Album.
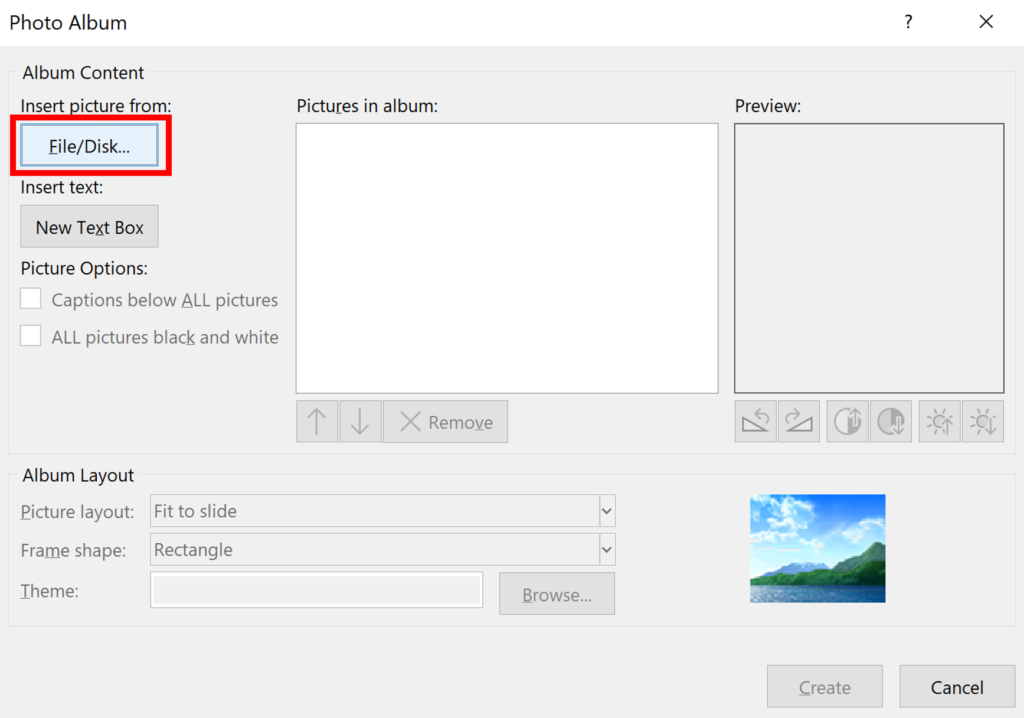
Click on Insert picture from: File/Disk…
Select all the pictures and then click Insert.
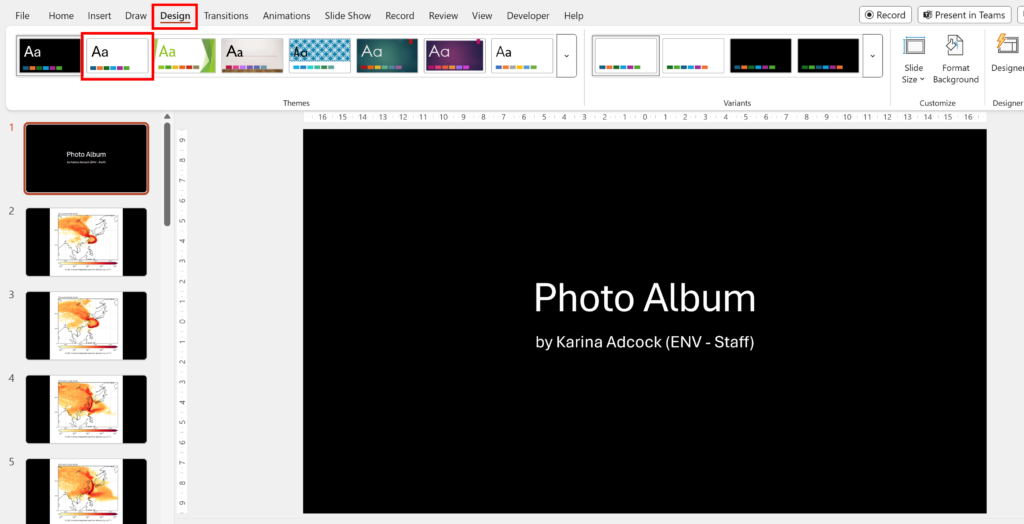
Click on Create.

This puts all the selected images into a presentation with each image on its own slide. Go to the Design Tab and change the background color from black to white.
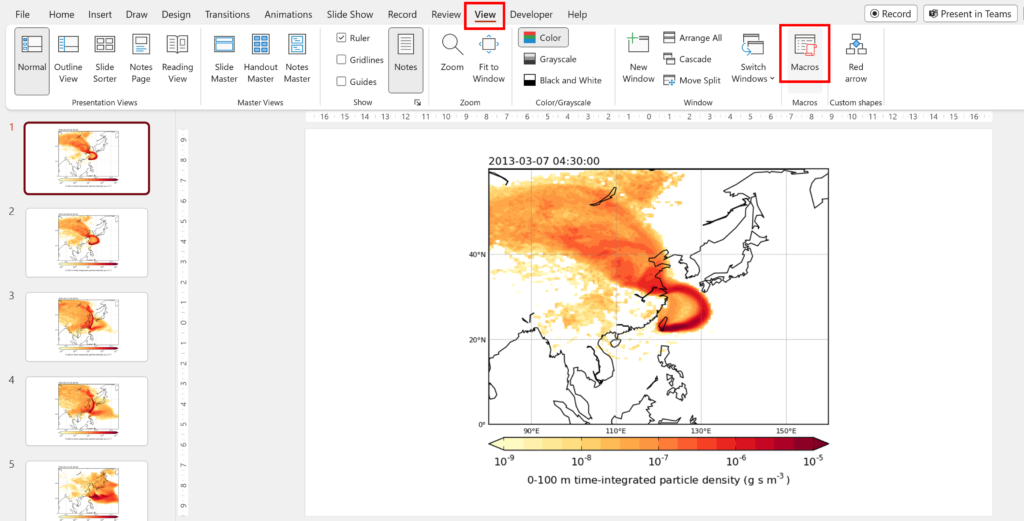
Next, go to the View Tab and select Macros.
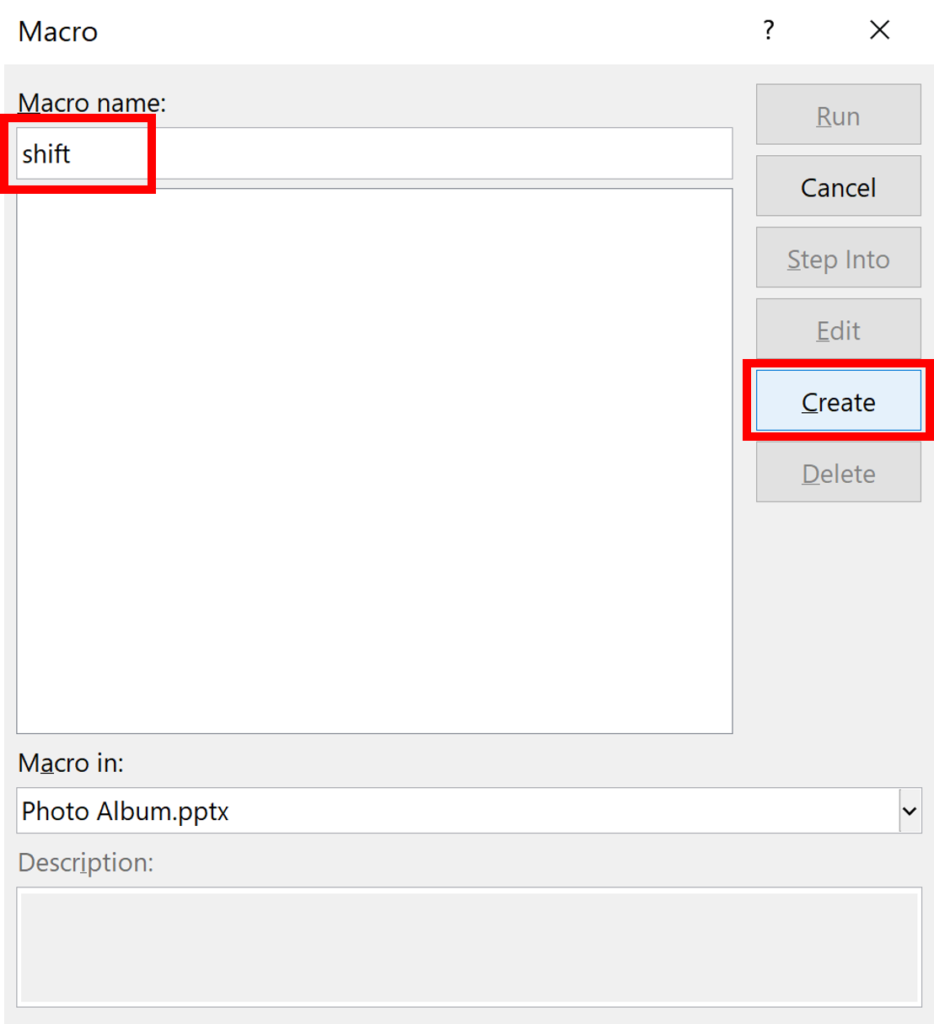
Give the macro a name, I called mine “shift” and then click Create.
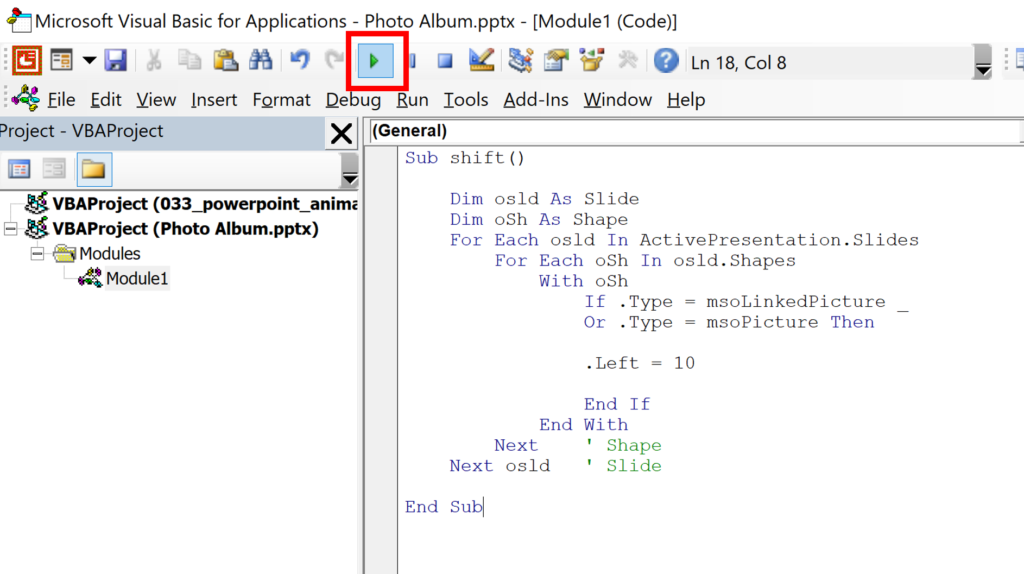
Copy and paste in this macro:
Sub shift()

Dim osld As Slide
Dim oSh As Shape
For Each osld In ActivePresentation.Slides
    For Each oSh In osld.Shapes
        With oSh
            If .Type = msoLinkedPicture _
            Or .Type = msoPicture Then

            .Left = 10

            End If
        End With
    Next    ' Shape
Next osld   ' Slide

End Sub
I got this macro from: https://stackoverflow.com/questions/26677302/positioning-images-on-slides-in-powerpoint-2007-using-vba
Then, run this macro and it will shift all of the images to the left hand side.
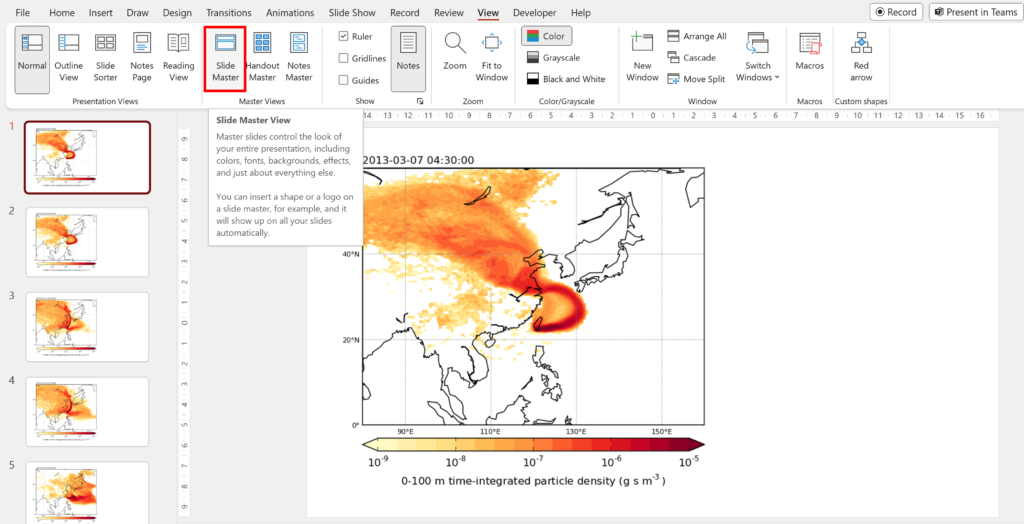
Now, select Slide Master.
In Slide Master scroll up to the first slide and on this slide insert a chart showing the atmospheric concentrations. Put this chart on the right hand side. Then, click on Close Master View.
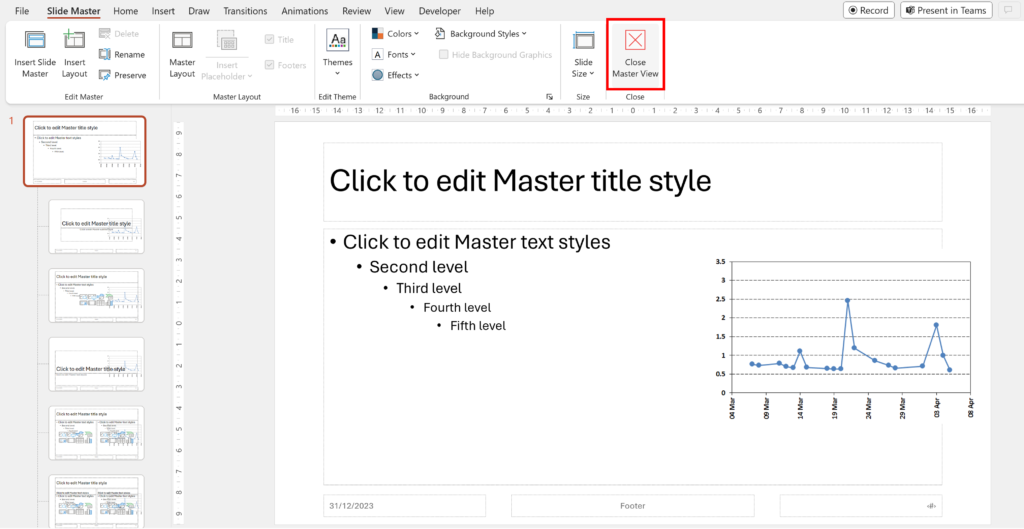
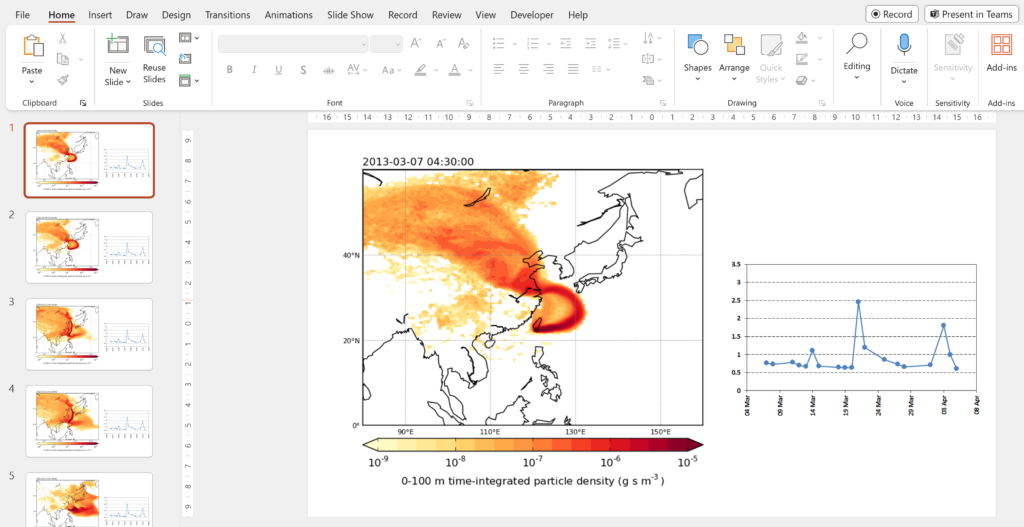
This put the chart in every slide, so we can now see the atmospheric transport footprints side by side with the atmospheric concentrations.
Go to Shapes and select the star.
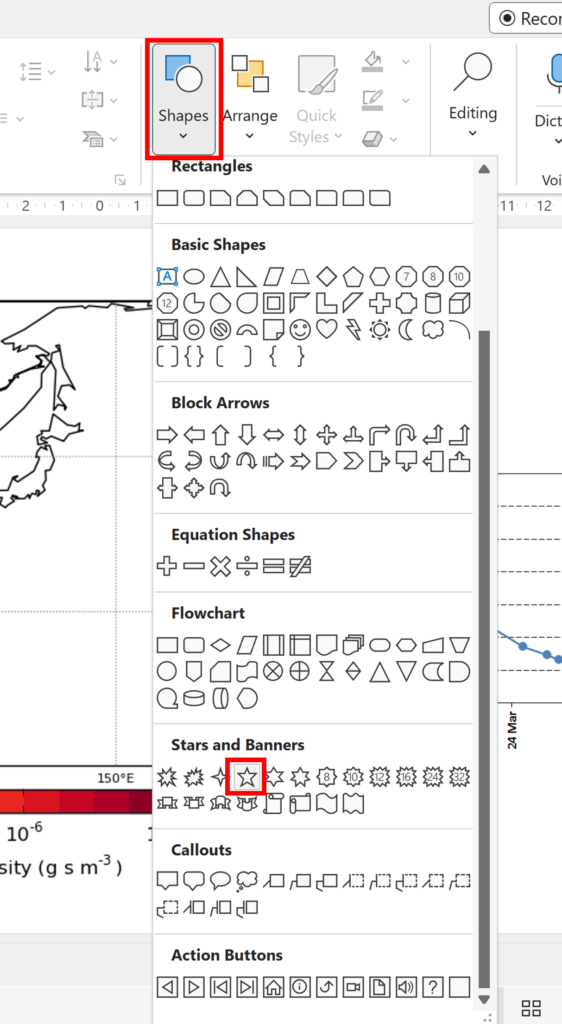
Click and drag to draw a small star, change the color to black and then position the star over the first data point in the chart.
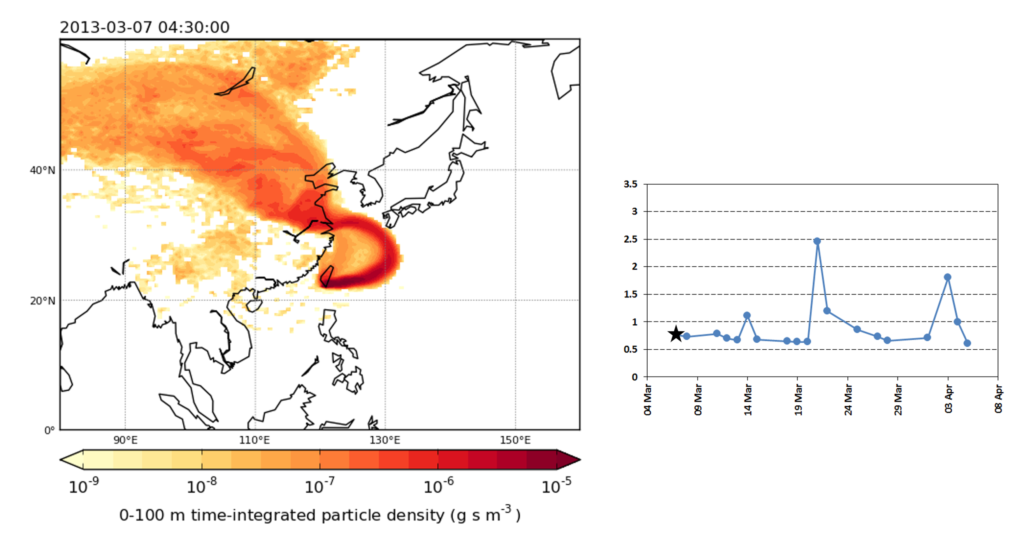
Then copy the star, move to the next slide, paste the star and use the arrow keys on the keyboard to move the star to the next data point. Repeat this process for all of the data points.
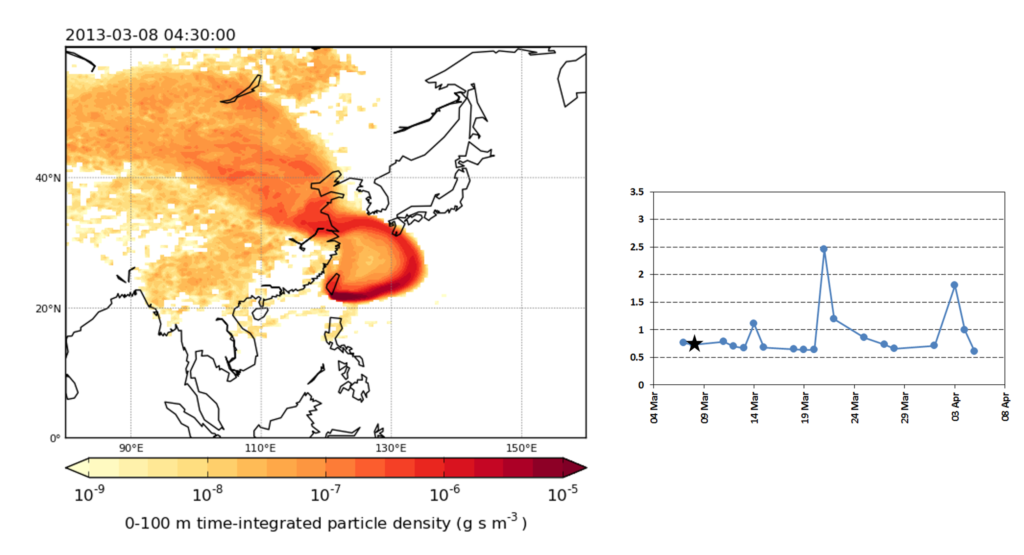
Now, when we play the powerpoint presentation, we can see where the air mass was coming from when the concentrations were higher, and therefore where is the likely source of the compound.