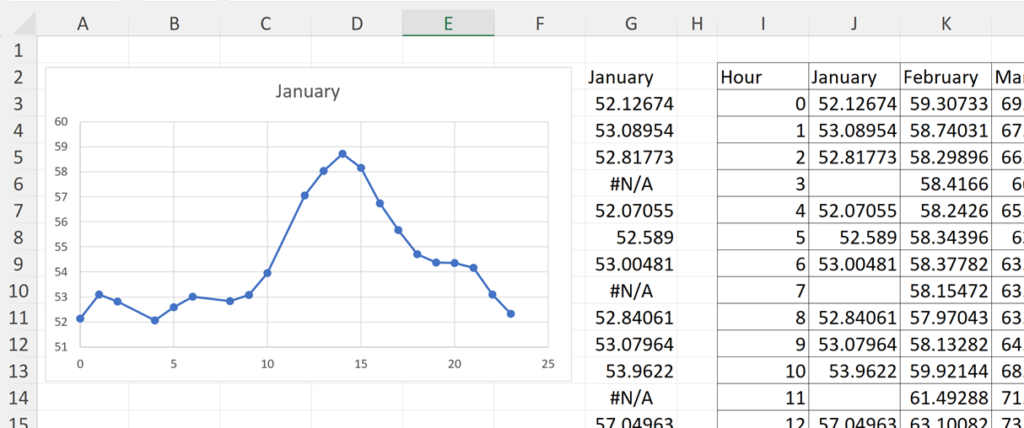
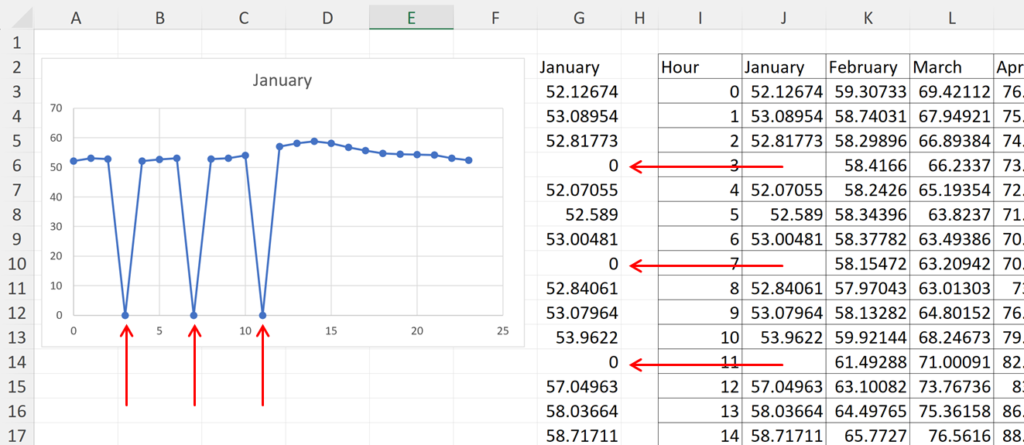
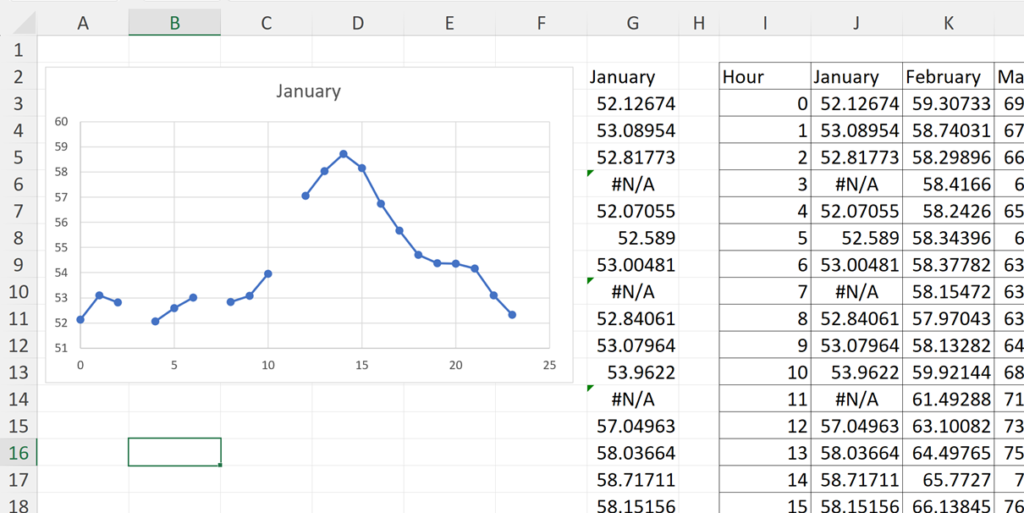
Sometimes in excel a formula will turn blank cells into zeros, and this will be plotted in a chart even though its not actual data.
There are two methods for removing this:
Method 1
Select the whole table and then on the Home tab go to Find & Select > Replace
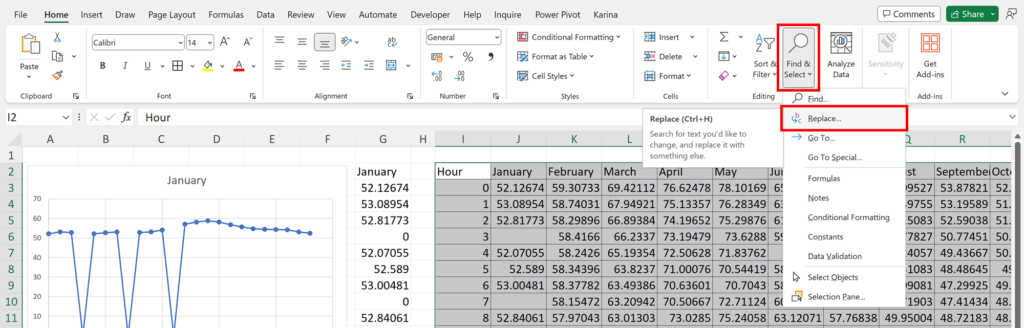
Leave the Find what: box empty and in the Replace with: box type #N/A, then click Replace All
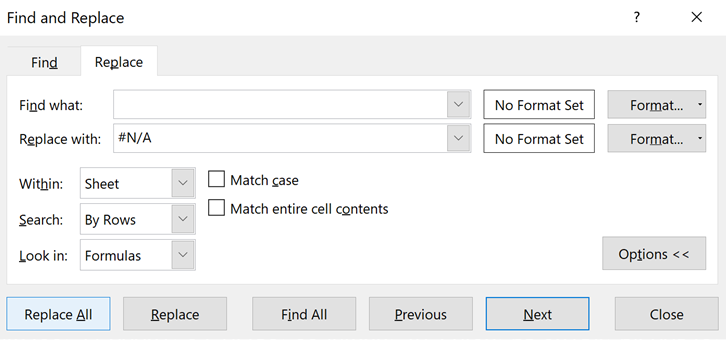
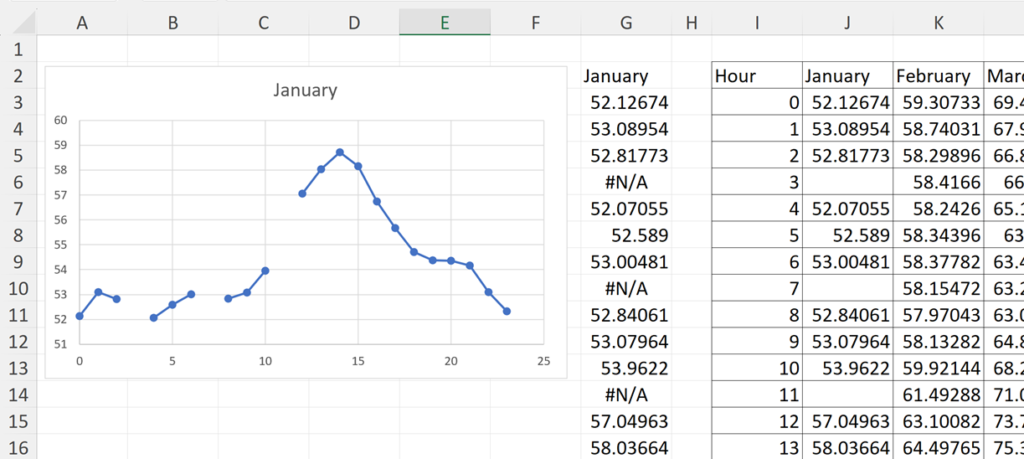
This will turn all the blank cells in the table into #N/A. The results of the formula instead of being 0 will be #N/A. Excel charts do not plot #N/A so this will stop those values from being plotted in the chart.
Method 2
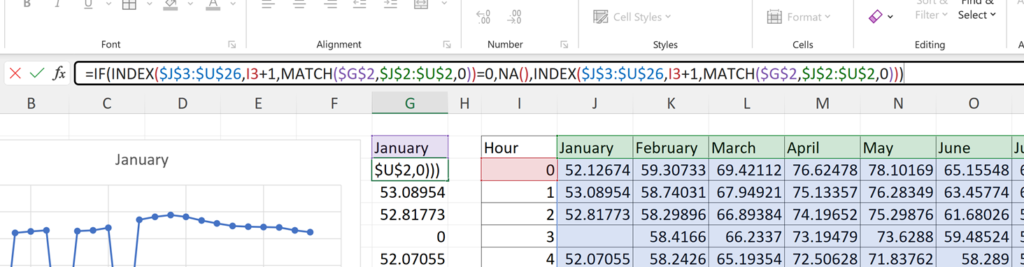
Change the formula:
=IF(original_formula=0,NA(),original_formula)
Wrap the original formula inside an IF formula. If the result of the original formula is equal to zero then give an NA() instead, and if not then give the result of the original formula.
This will turn all the zeros from the formula into #N/A and will stop those values from being plotted in the chart.
Remove gaps
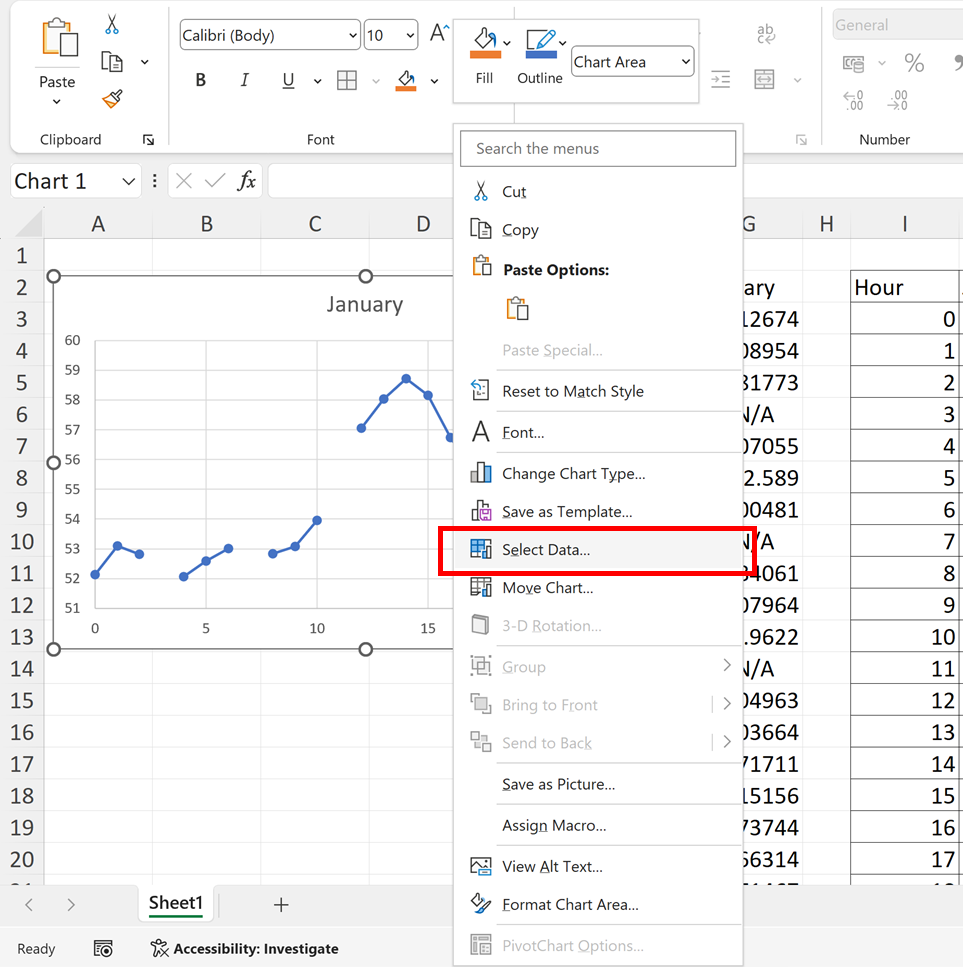
To remove the gaps in the chart, right click on the chart and go to Select Data…
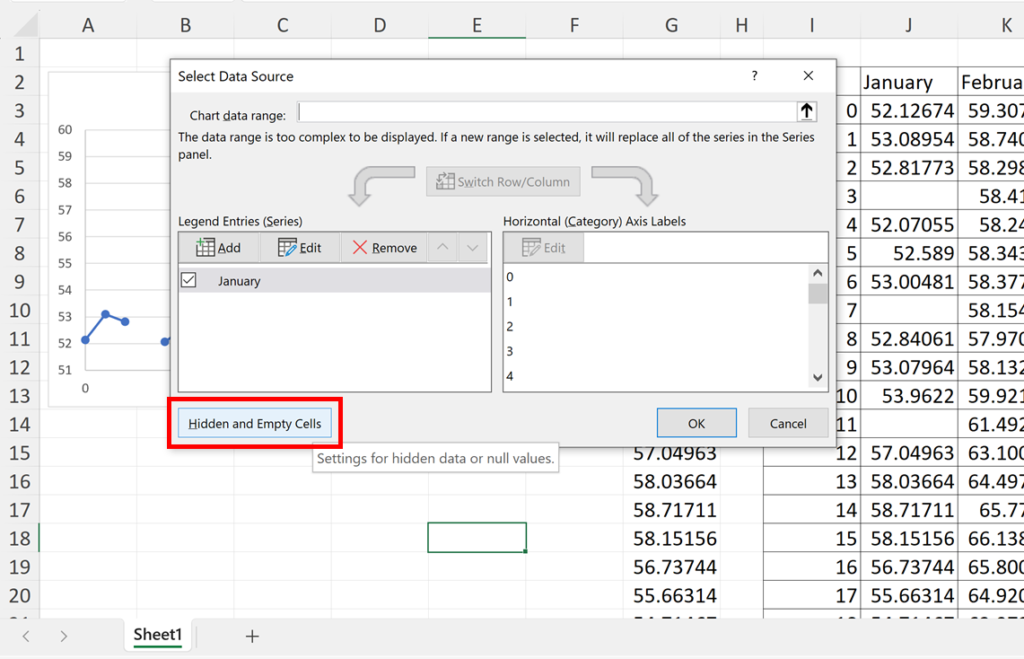
Go to Hidden and Empty Cells
Change Show empty cells as: to Connect data points with line
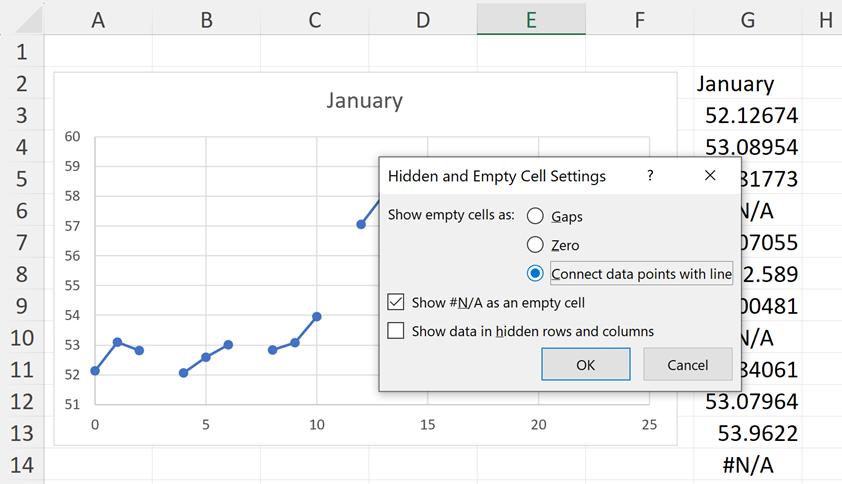
This removes the gaps and joins the data points on either side of the gap.