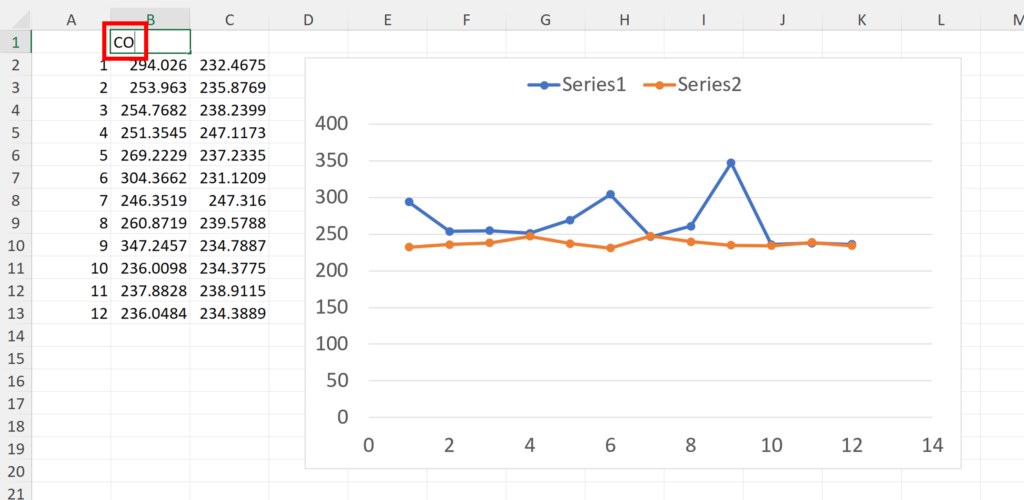
Firstly, I want the legend for Series 1 to be CO2. So I’ll start by typing CO into a cell.
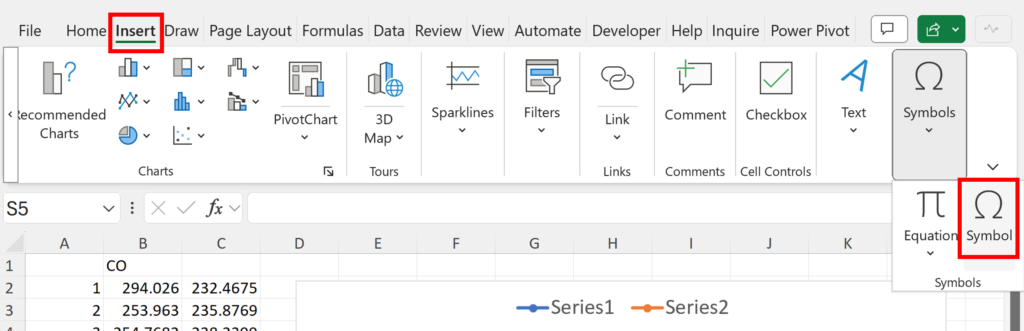
Go to the Insert Tab and select Symbols.
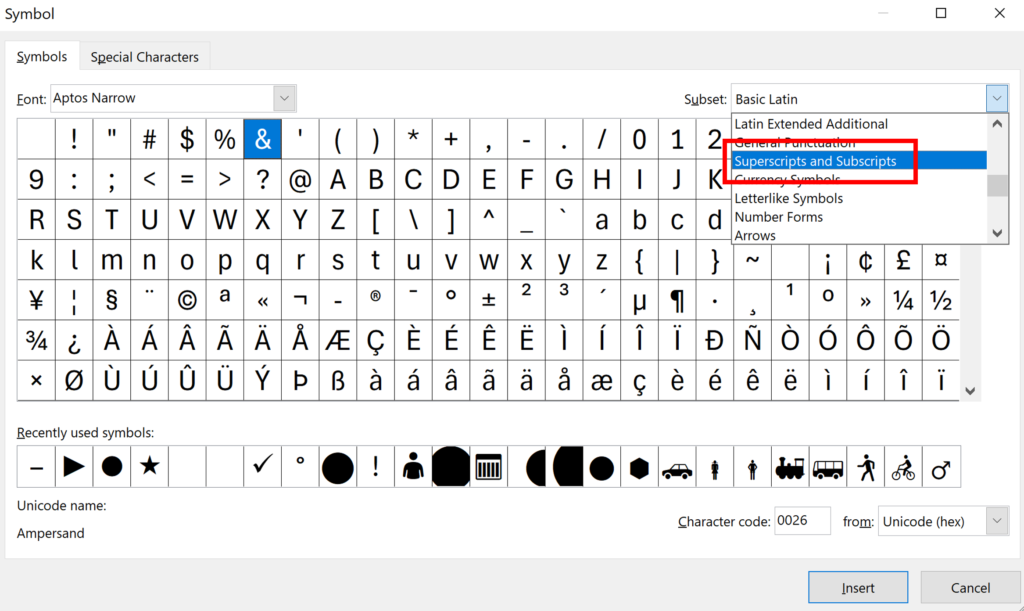
Use the dropdown list to find Superscripts and Subscripts.
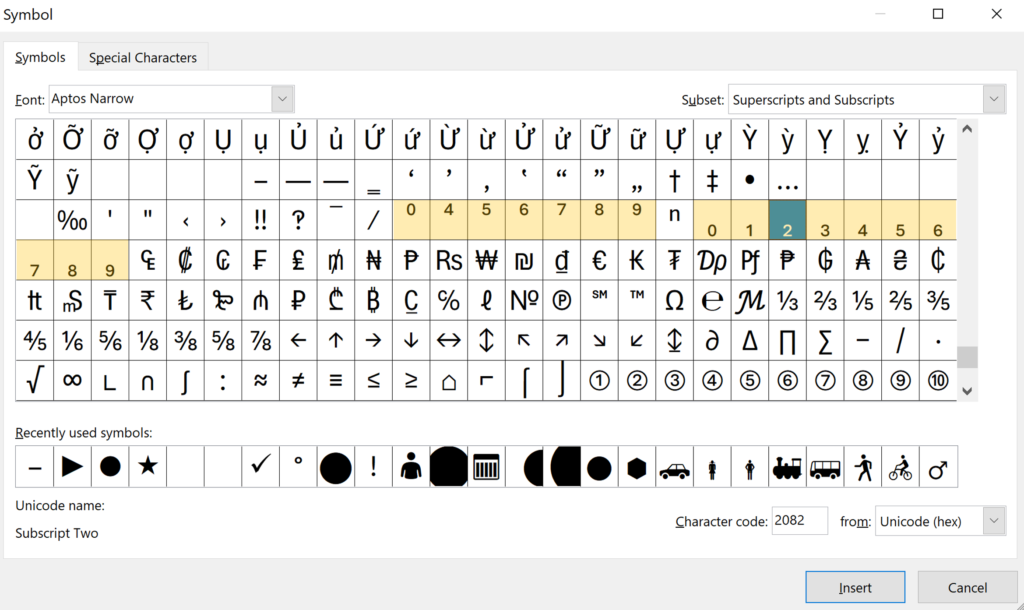
This is where most of the superscript and subscript numbers are. I will select the subscript 2 and then click Insert.
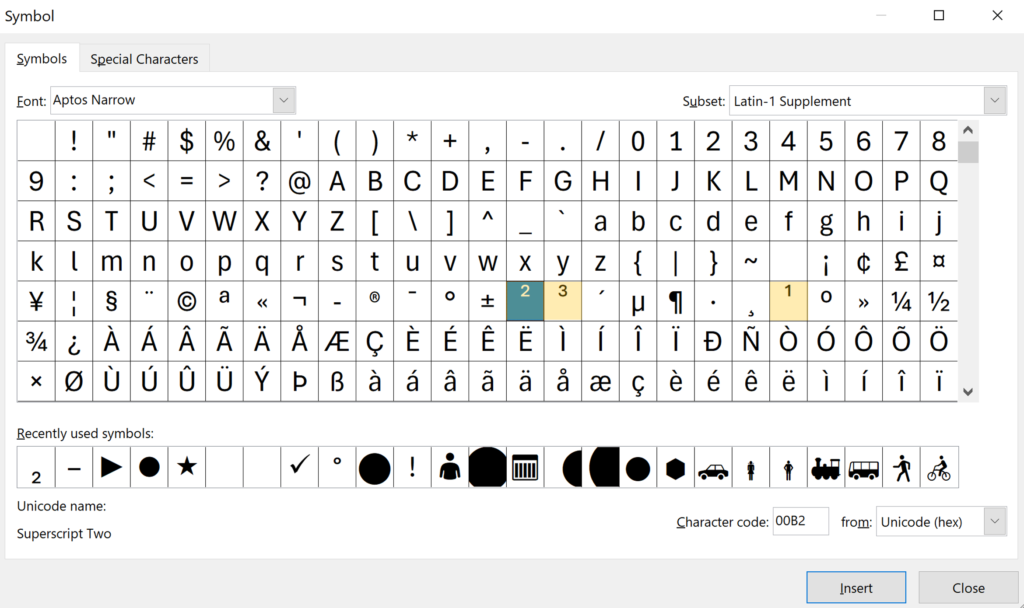
The superscript 1, 2 & 3 are in a different place, if you want these numbers, scroll back up to the top and you will see them in the Latin-1 Supplement section.
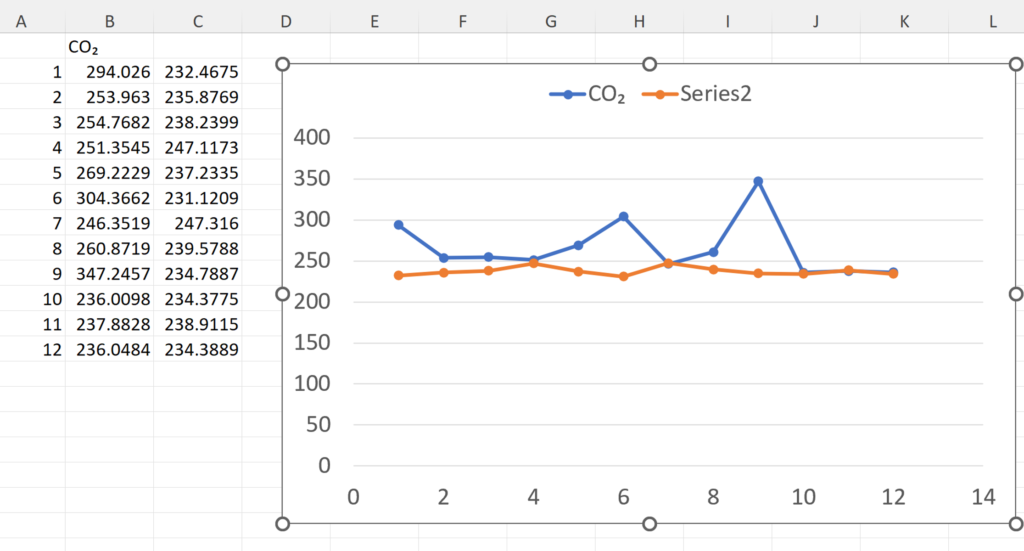
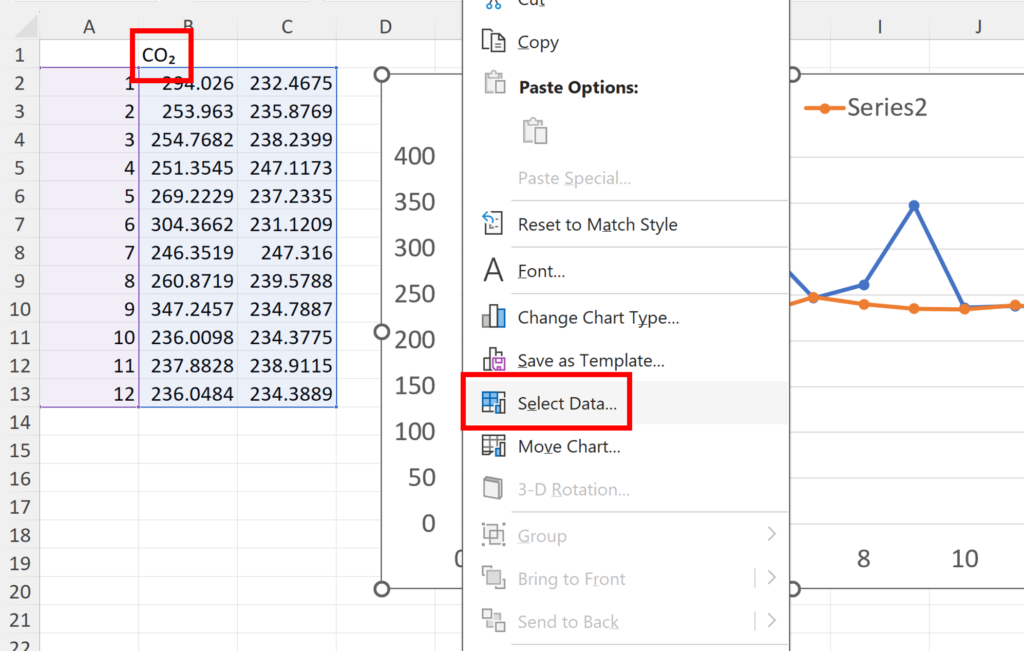
Now, we have CO2 in a cell, right click on the chart and click Select Data…
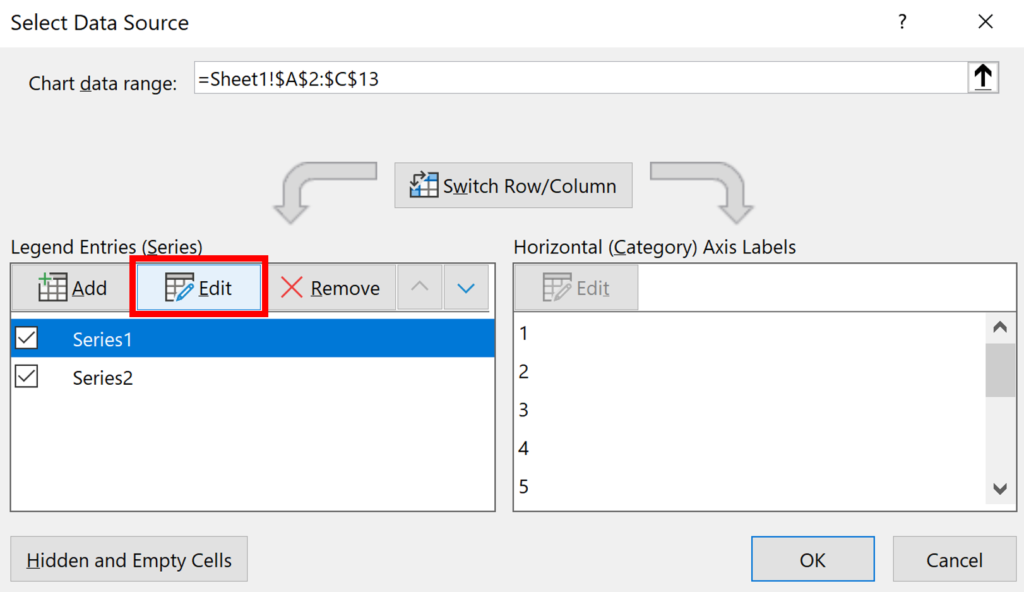
Then we will Edit the series.
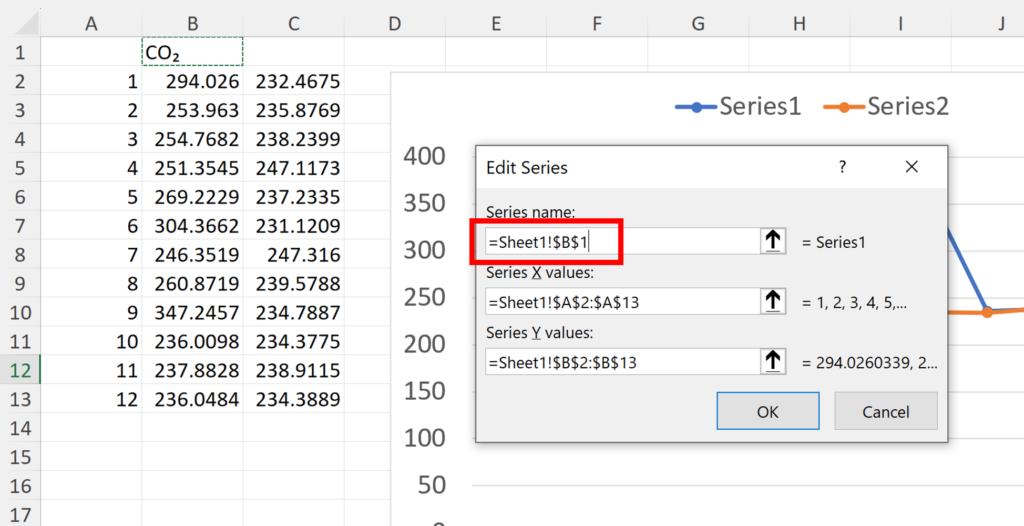
Change the series name so that it is linked to the cell with CO2 in it. Then click OK twice.
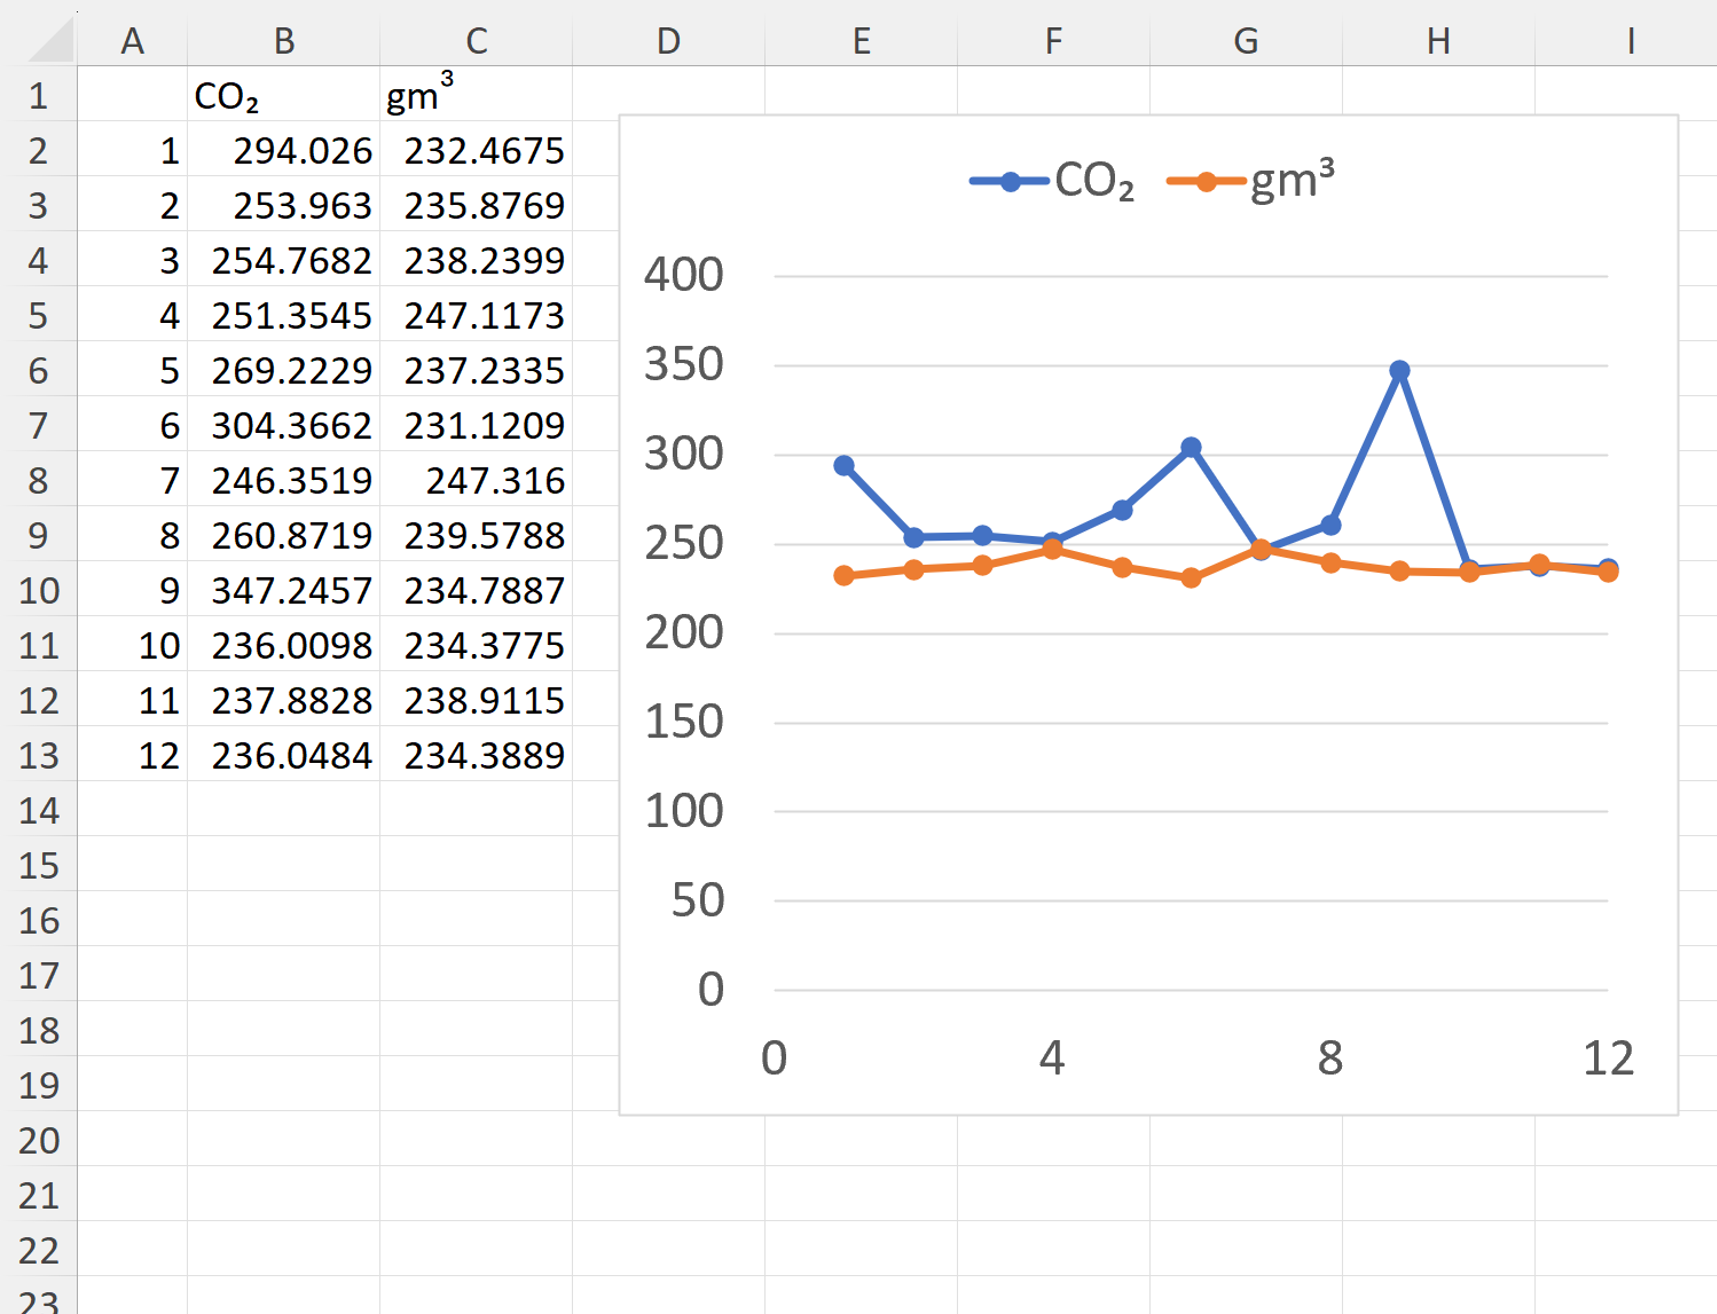
Now, for Series 1, there is CO2 with a subscript 2, in the legend of the chart.