Skip to content

    KEA training

    Microsoft Excel tutorials for scientists

    • Home
    • Excel
    • YouTube

    Category: Pivot Table

    • Home
    • Excel
    • Pivot Table
    Excel Pivot Table

    How to unpivot a dataset using a Pivot Table

    December 22, 2023December 22, 2023 Karina Adcock

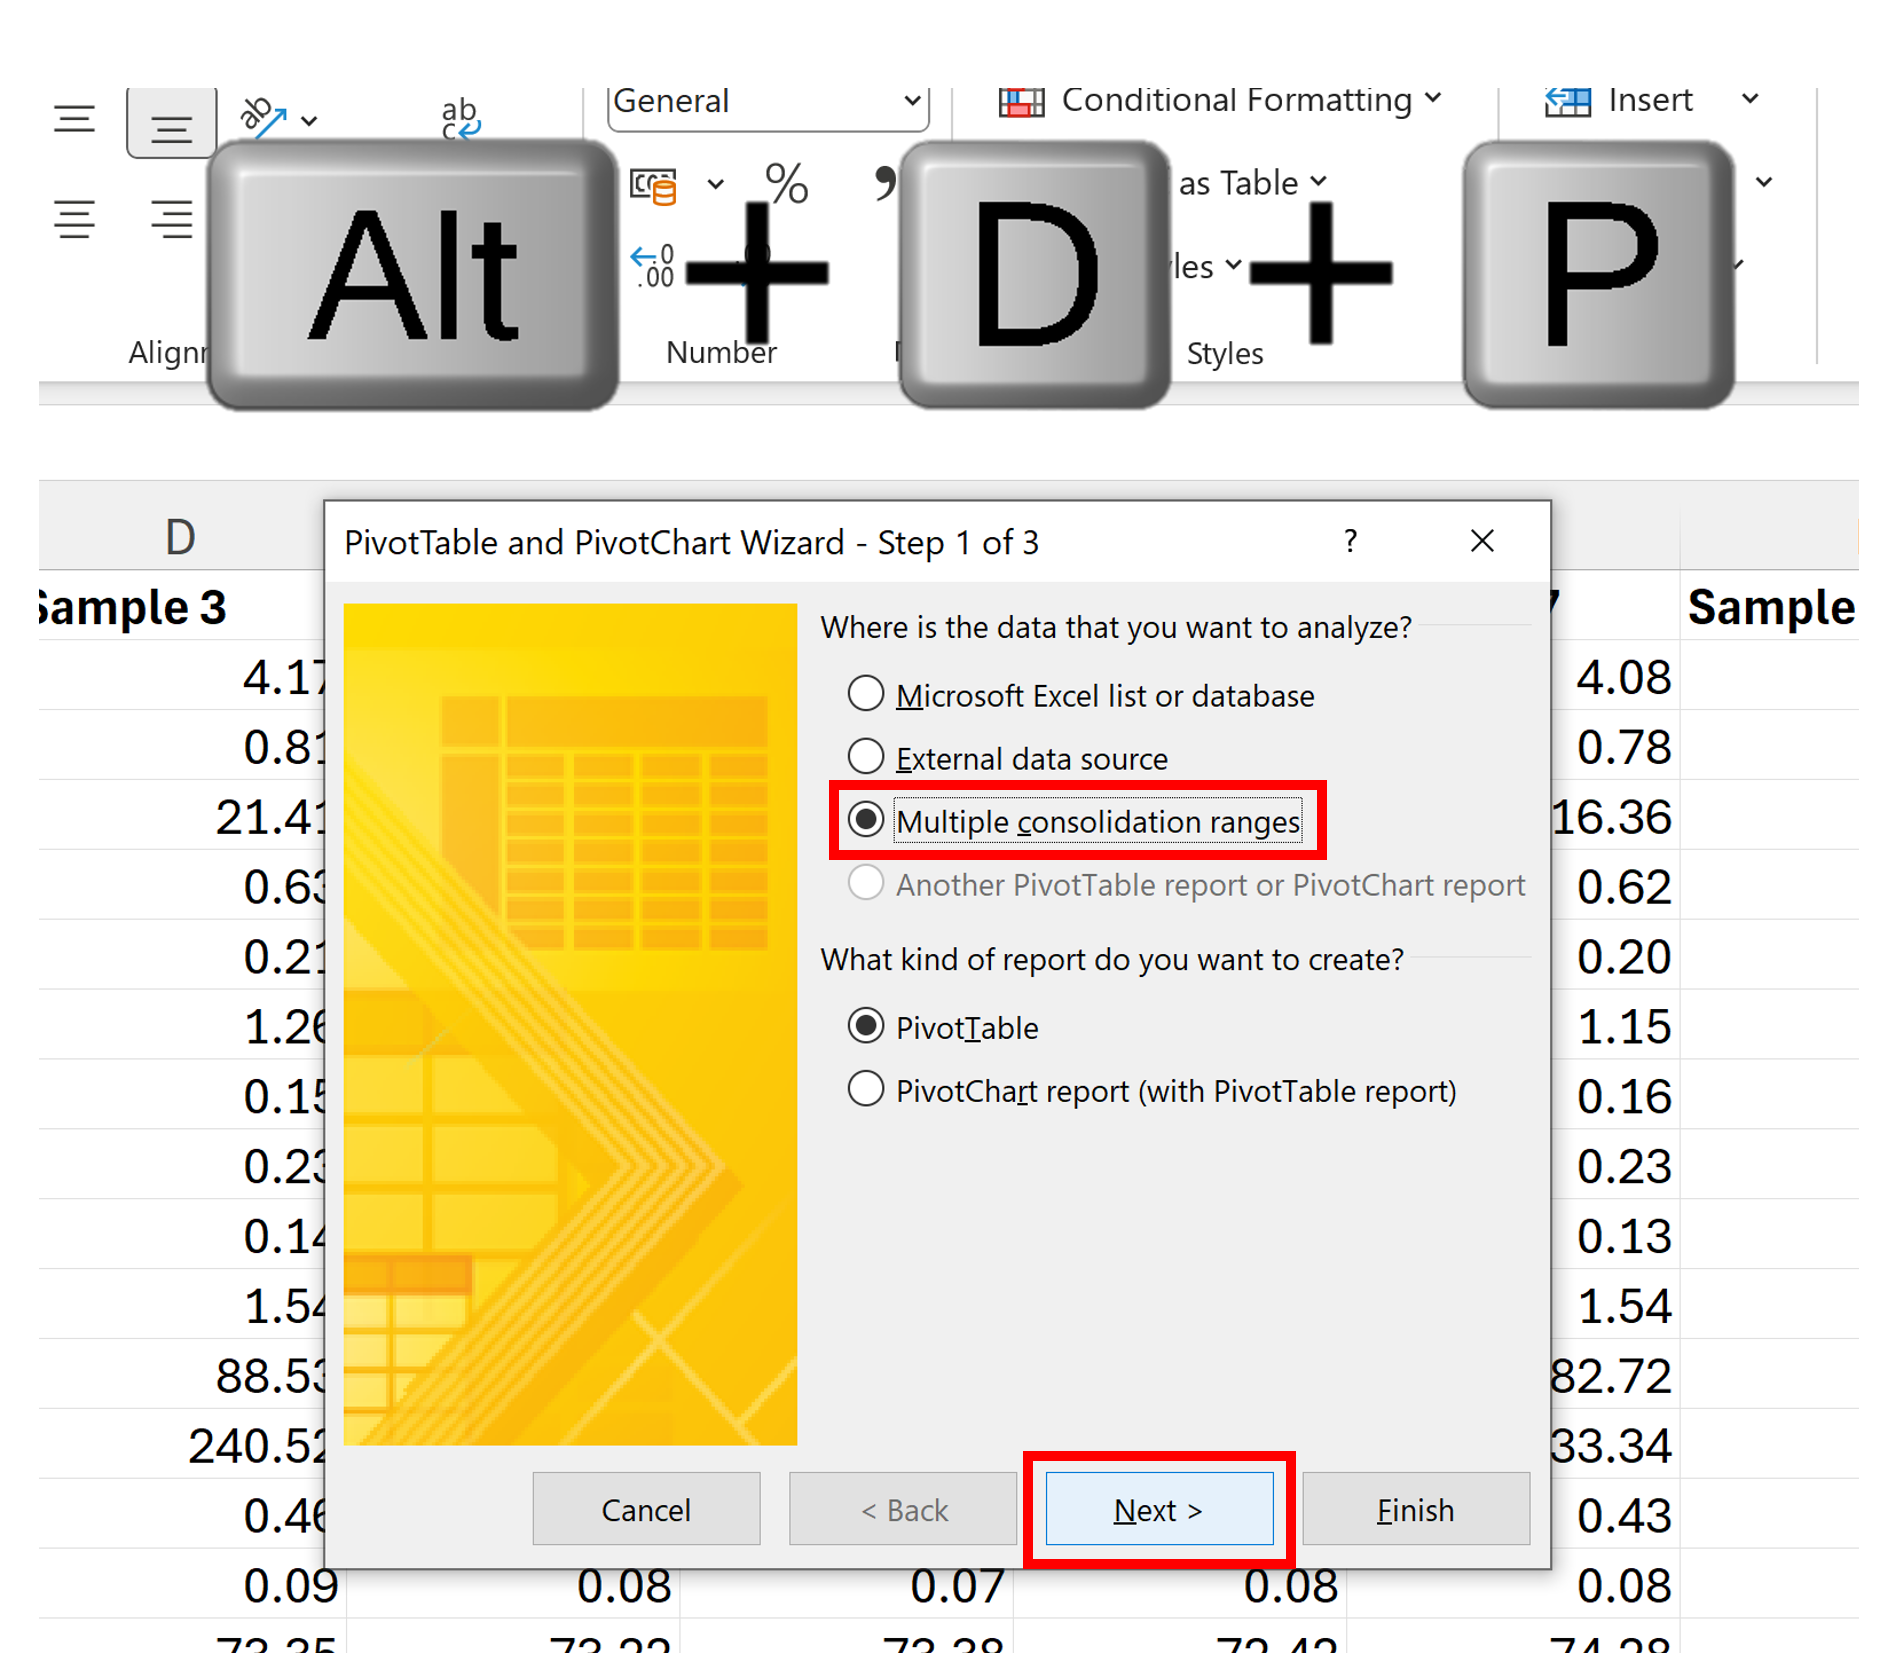
    Rearrange a dataset using the old version of a Pivot Table

    Read More
    Charts Excel Pivot Table

    How to get error bars from a pivot table in excel

    April 11, 2023May 1, 2023 Karina Adcock

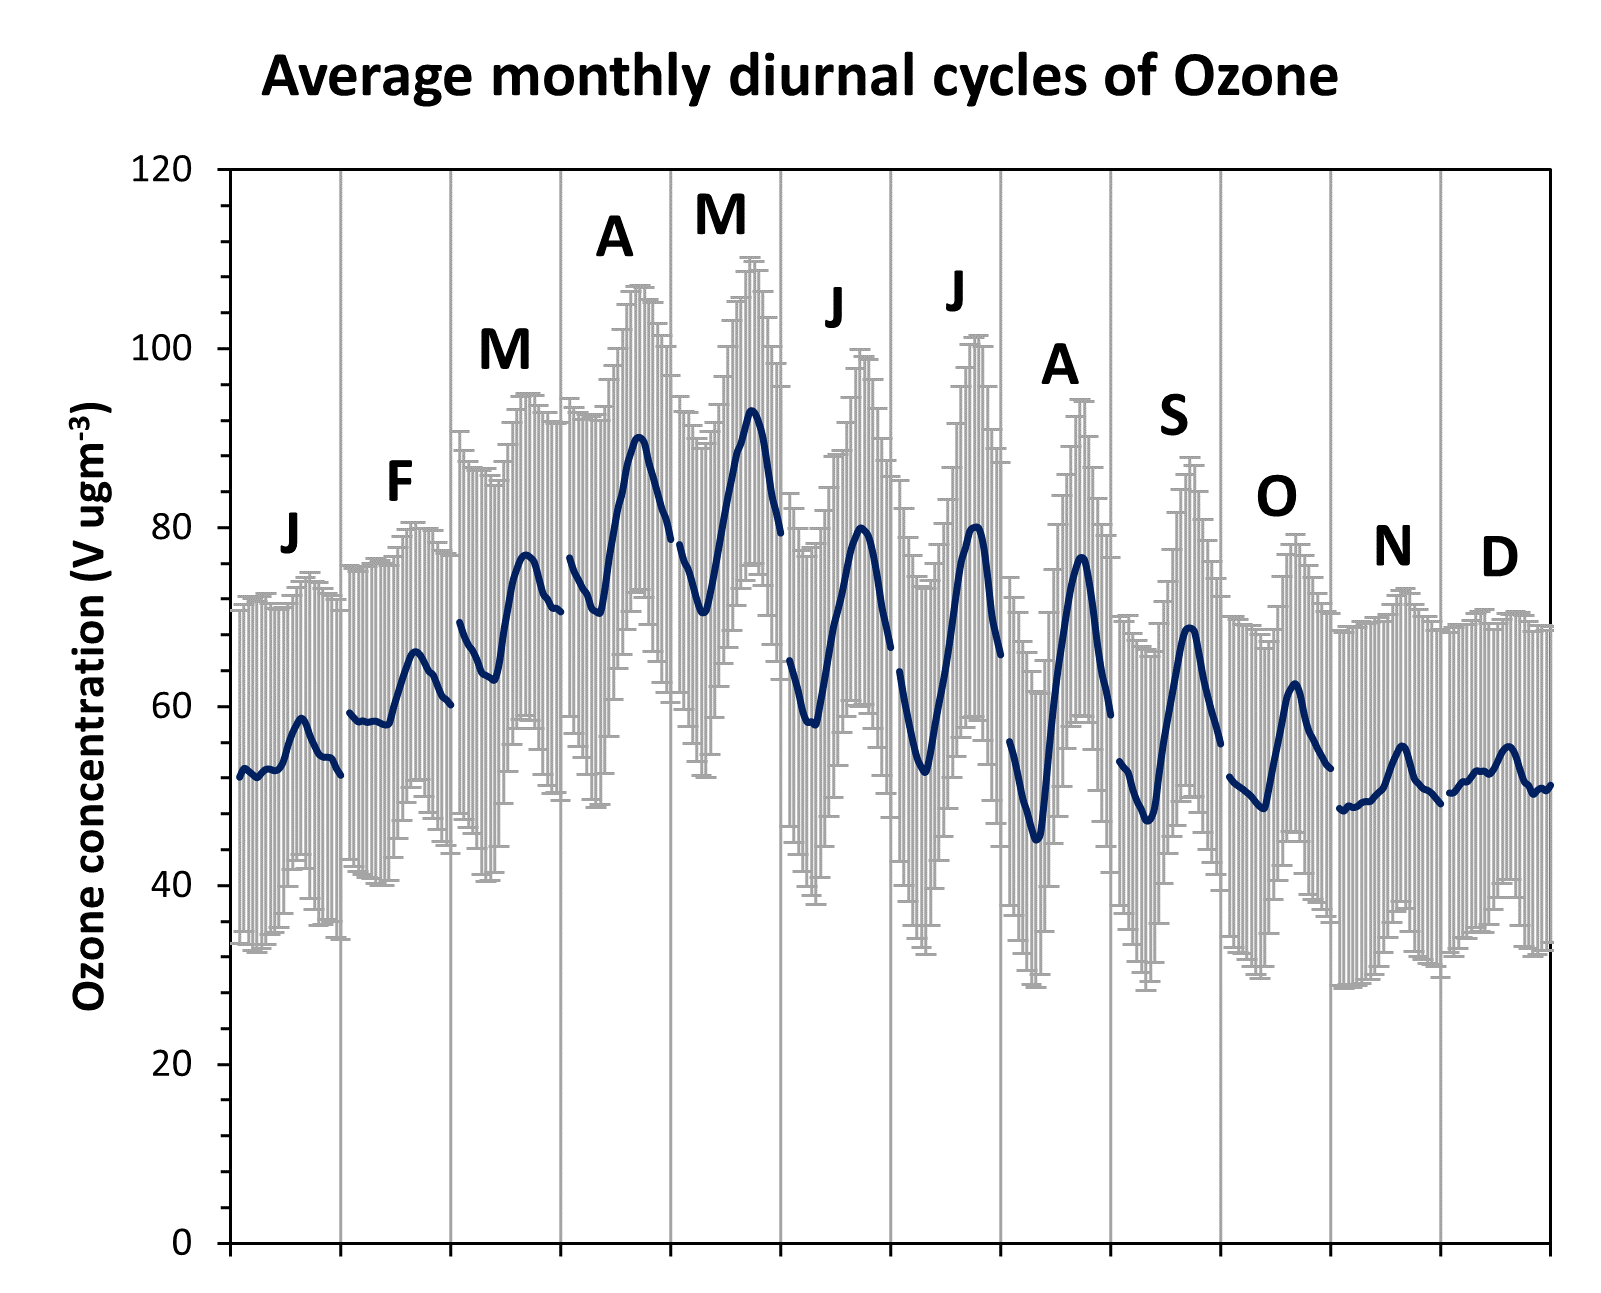
    Use a pivot table to calculate the one sigma standard deviation of the variation in ozone concentrations during the whole of the measurement period and then insert error bars into the chart of one standard deviation.

    Read More
    Charts Excel Pivot Table

    Plot monthly diurnal cycles of ozone using pivot tables in excel

    April 10, 2023May 1, 2023 Karina Adcock

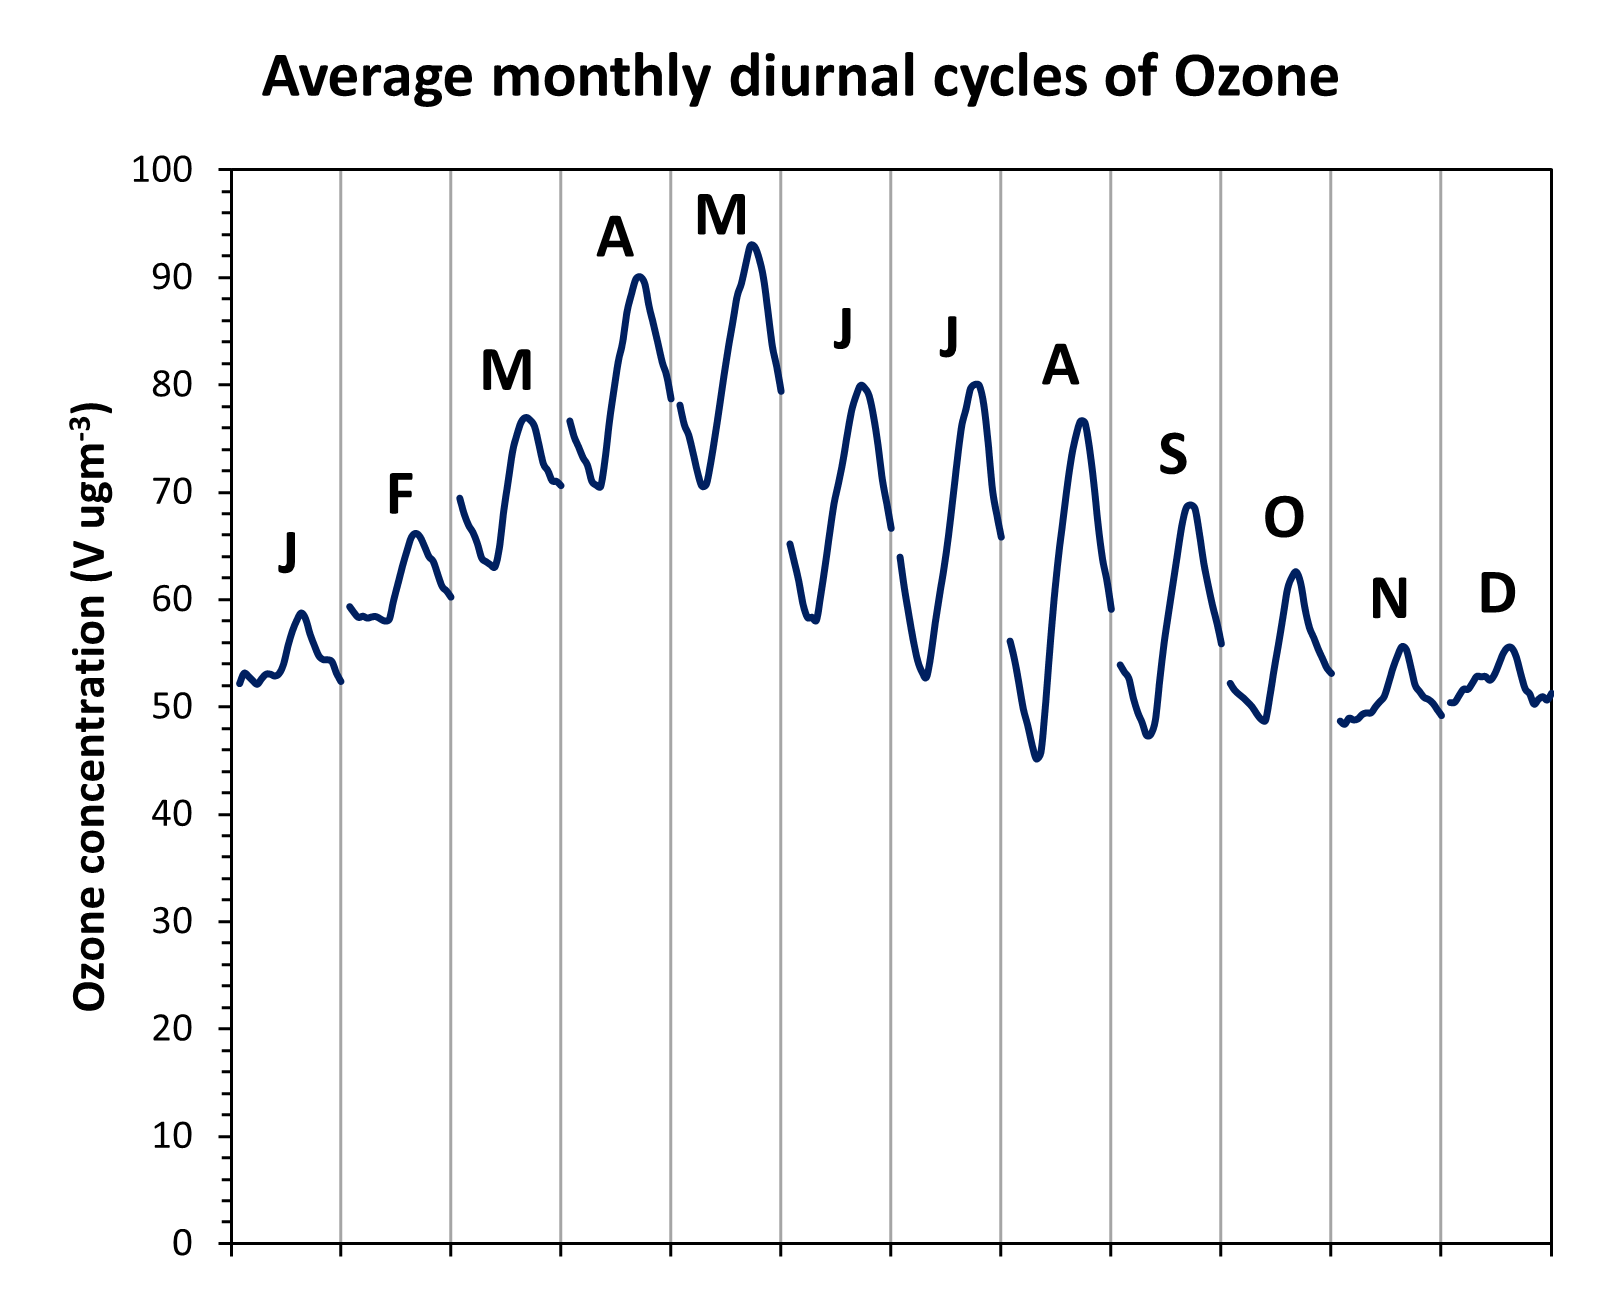
    Hourly ozone concentrations collected at Weybourne in the UK 2010-2014. Make a pivot table to calculate average monthly diurnal (daily) cycles and then plot them in a chart. Format the chart and add text boxes to label each month.

    Read More
    Charts Excel Pivot Table

    How to plot average seasonal daily cycles in excel

    April 7, 2023May 1, 2023 Karina Adcock

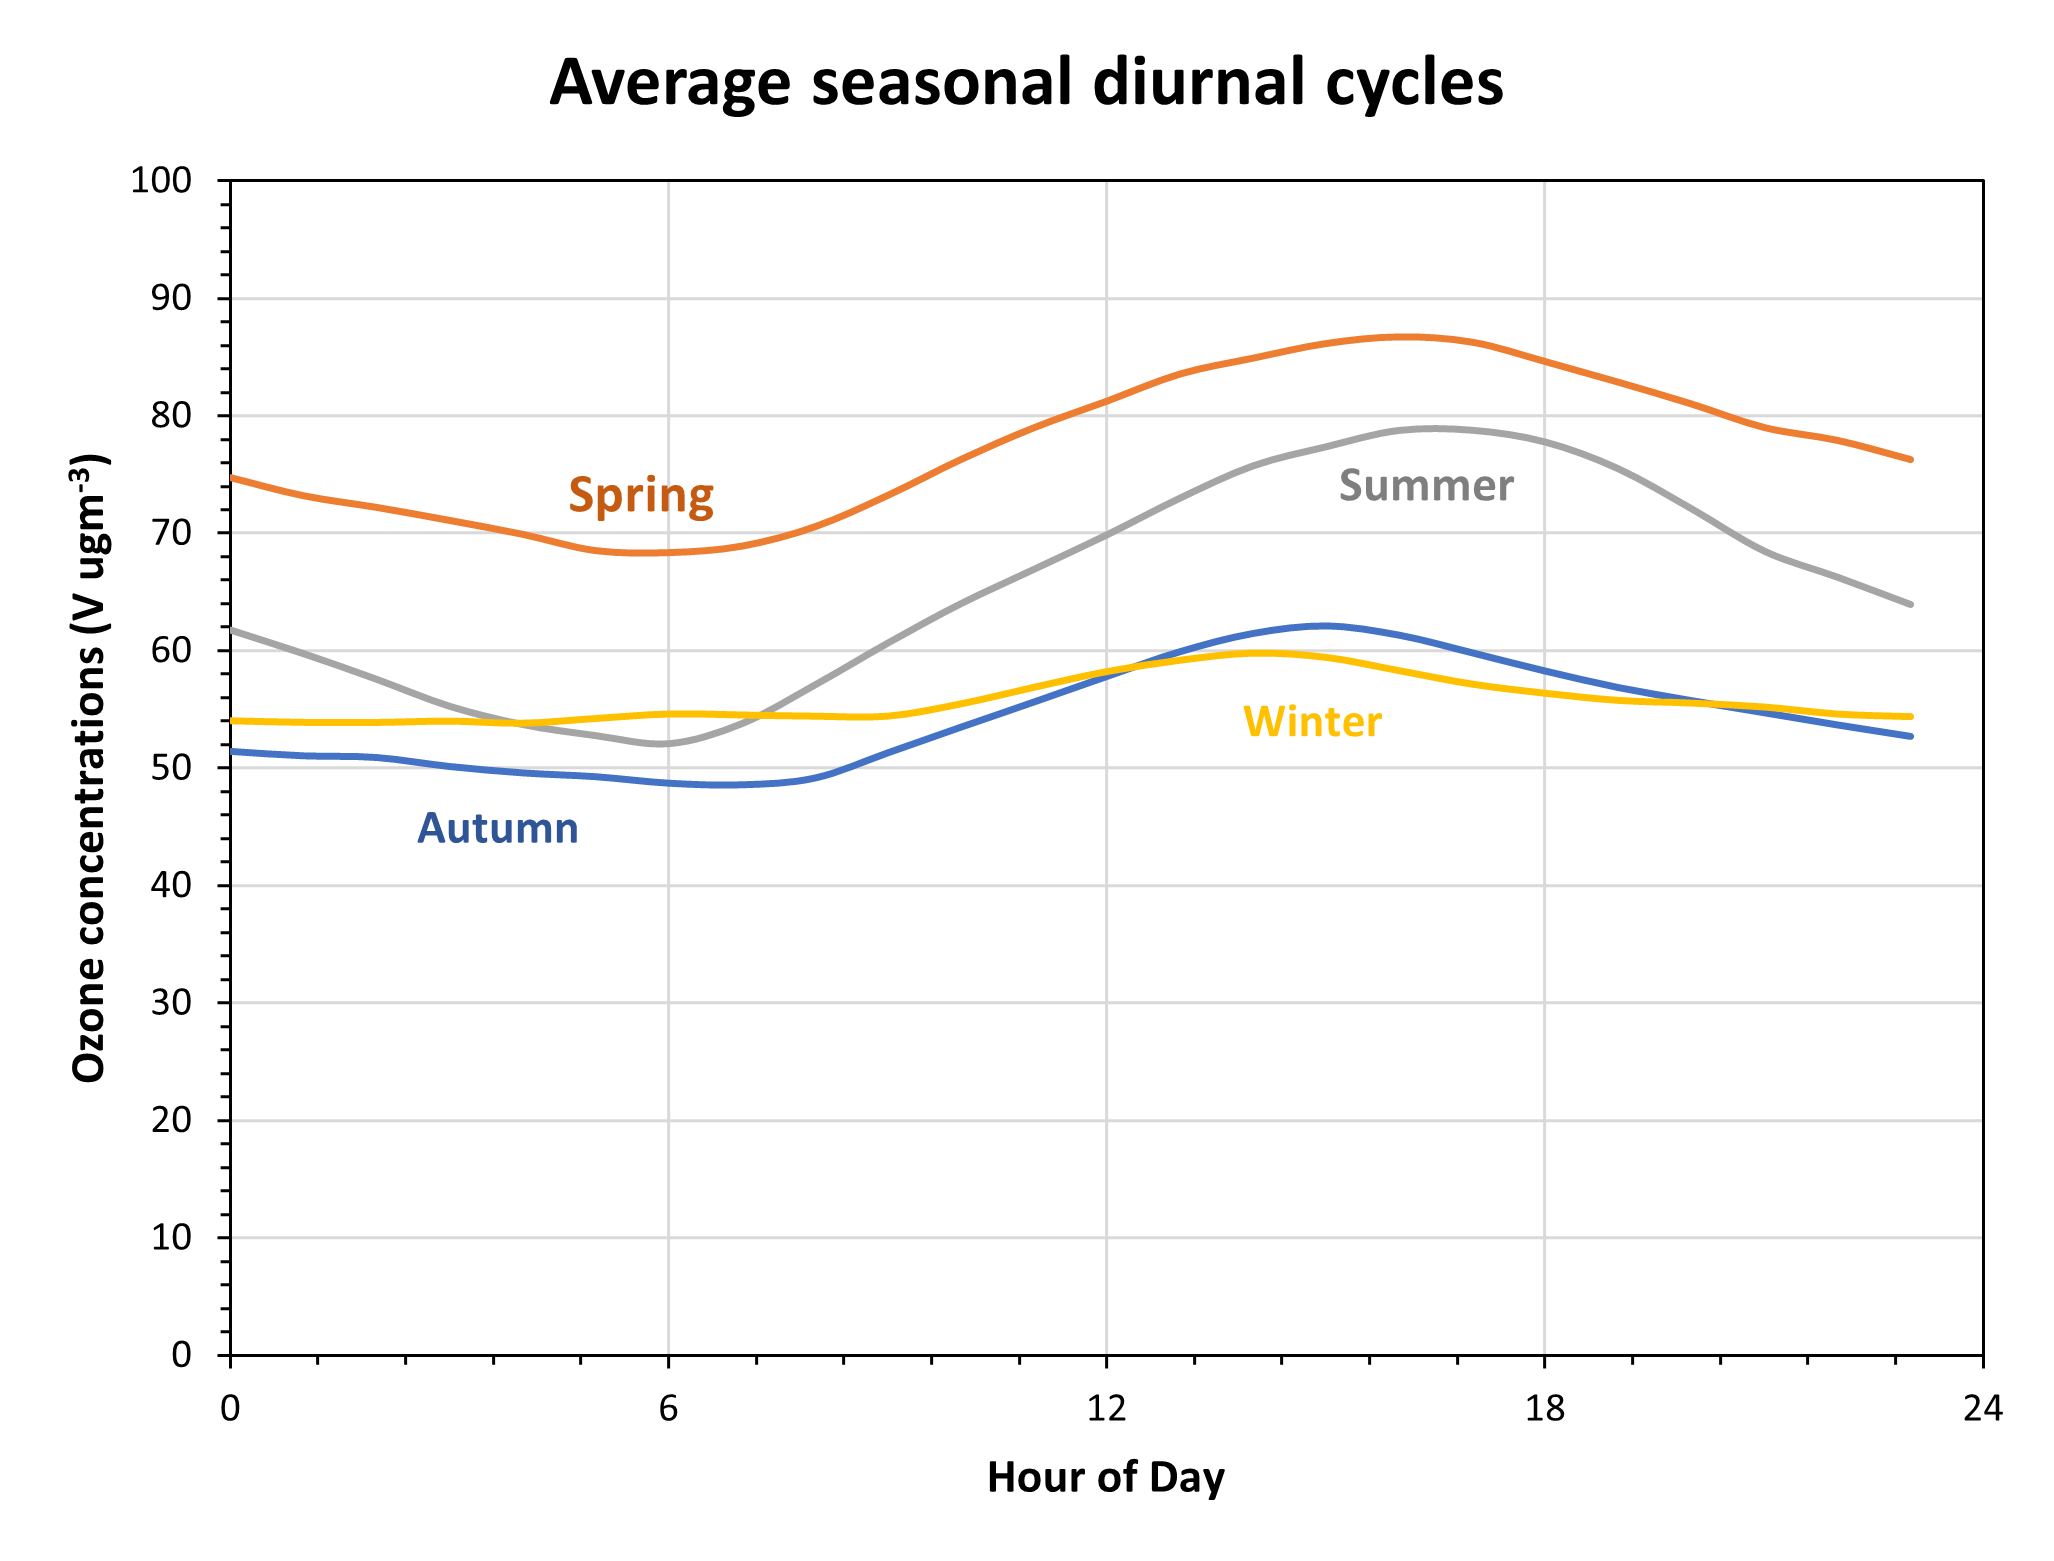
    Chart of average seasonal daily (diurnal/diel) changes with pivot table

    Read More
    All Rights Reserved 2024.
    Proudly powered by WordPress | Theme: Fairy by Candid Themes.