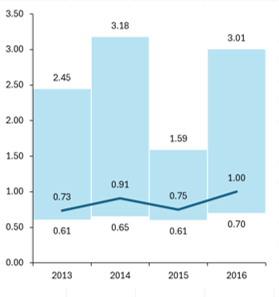
How to make a chart that shows the minimum, maximum and average values for each year.
Category: Excel

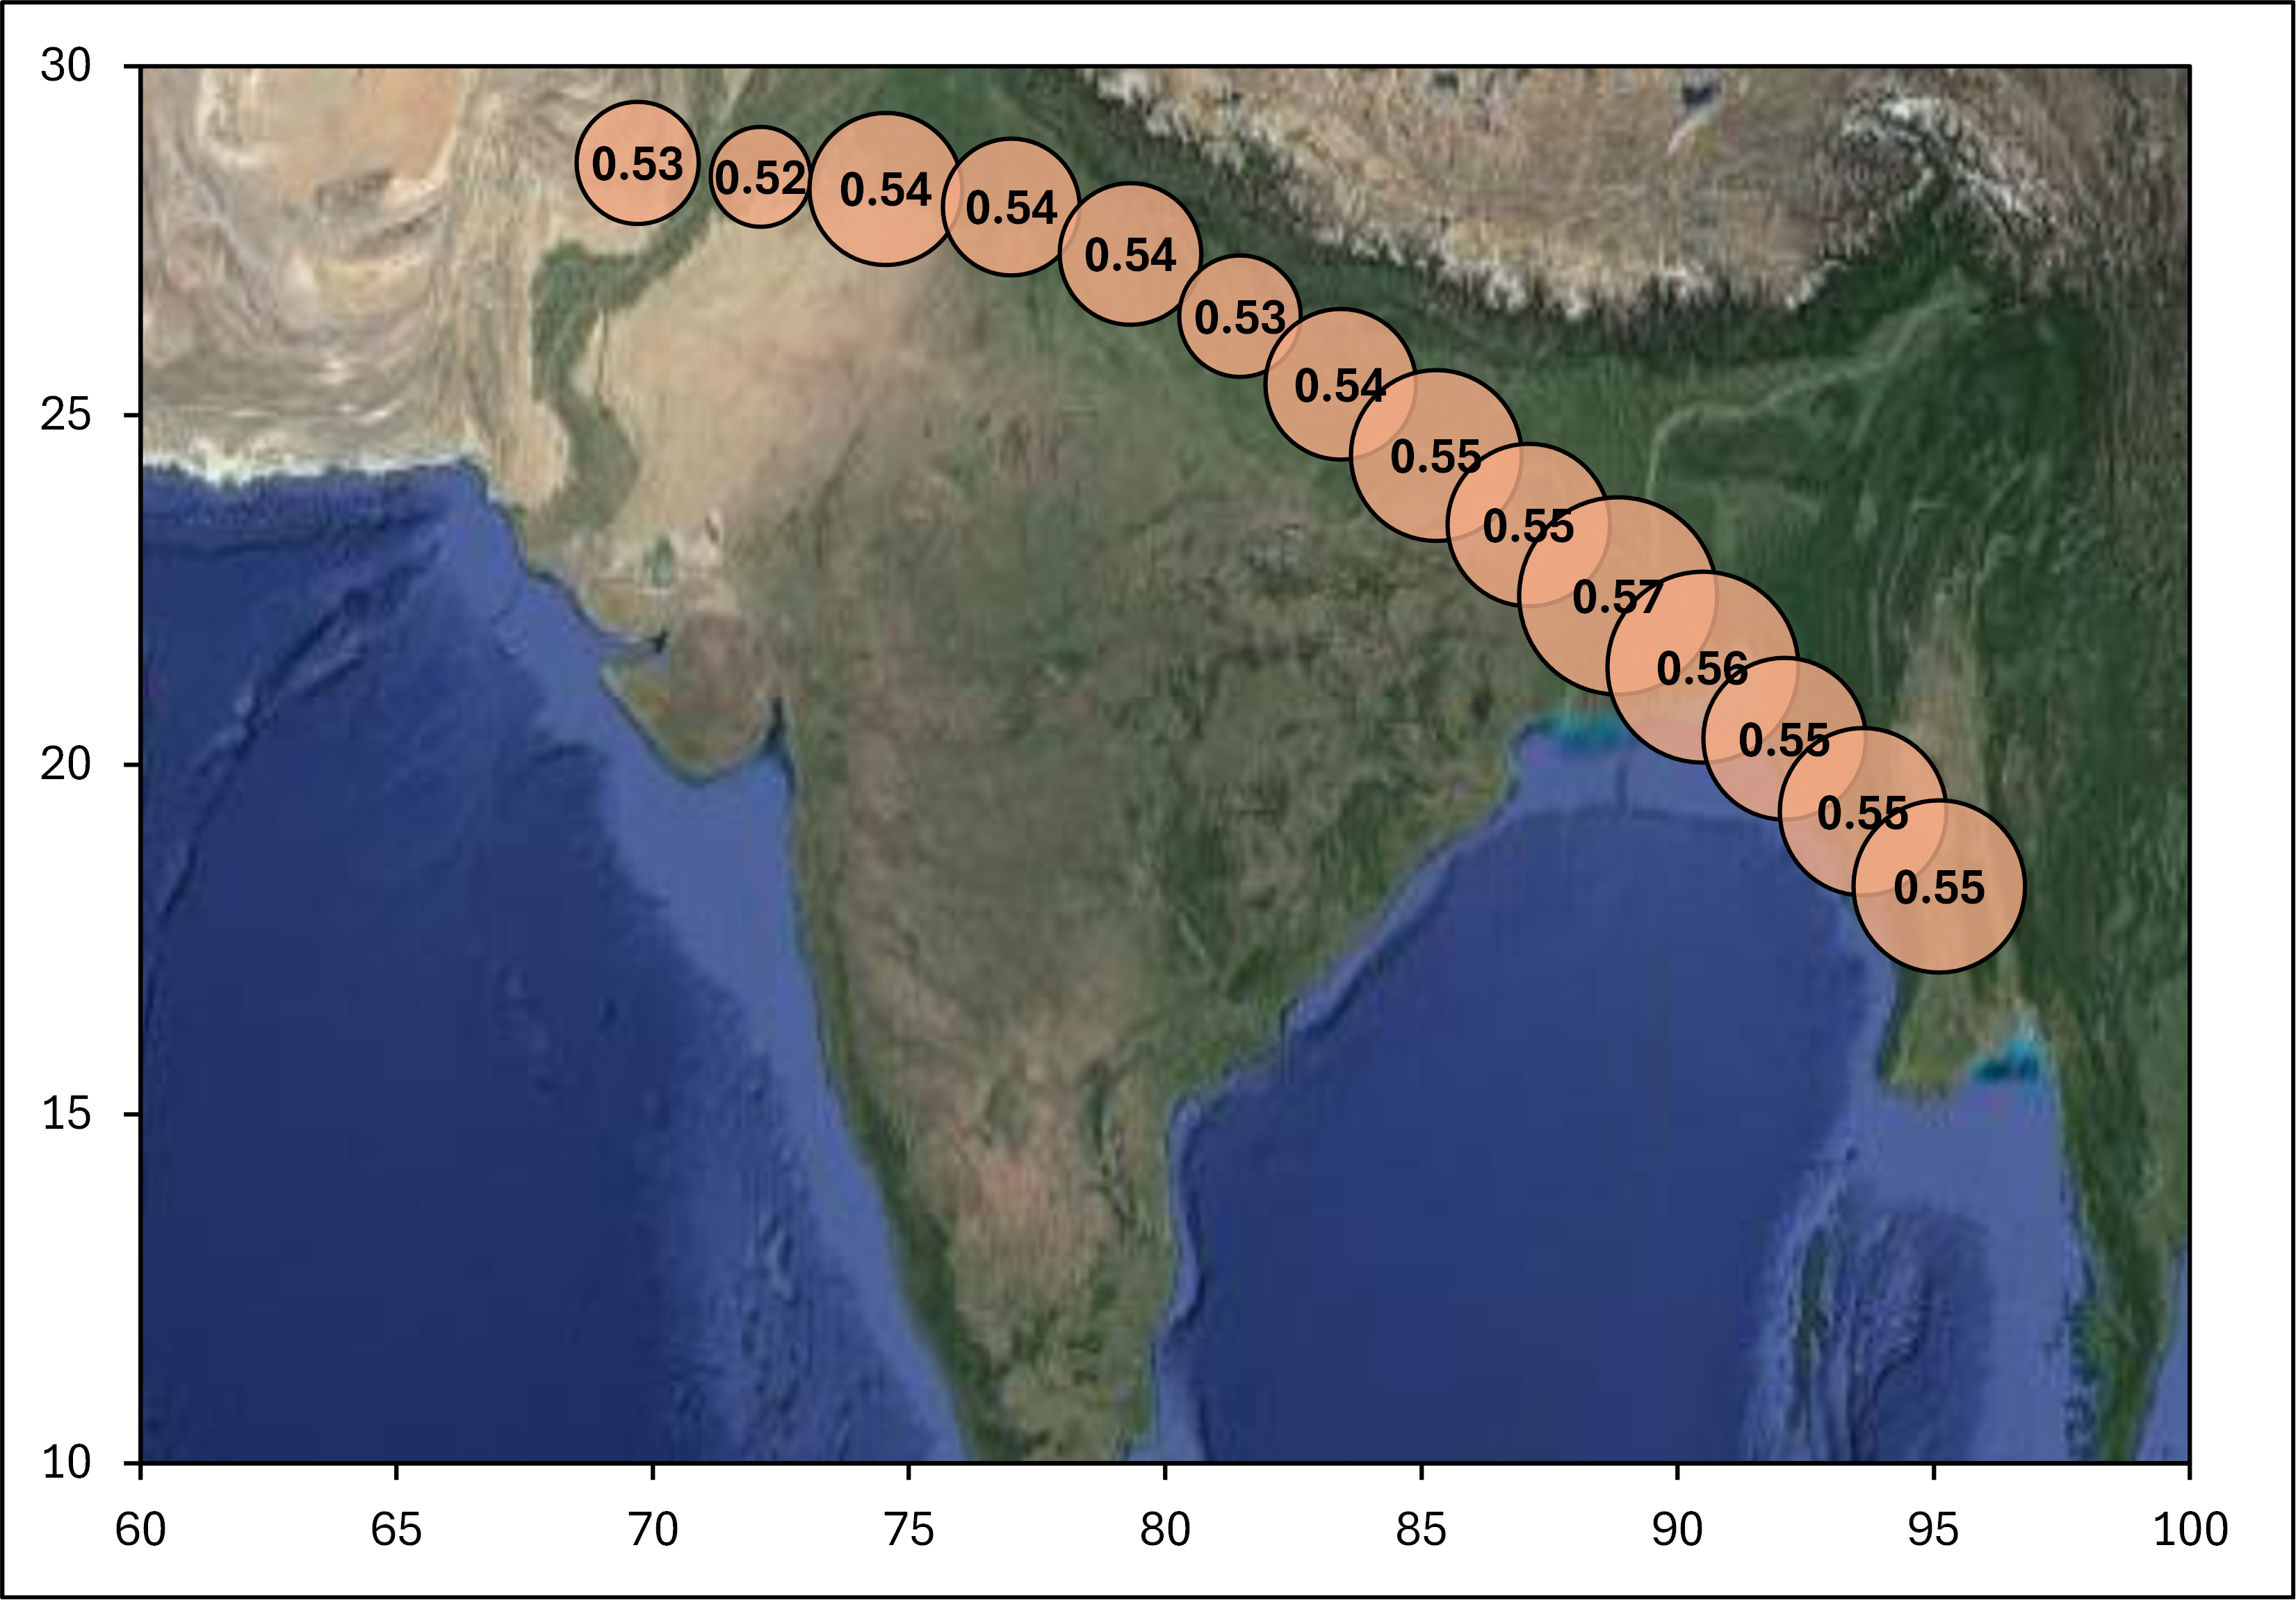
How to make a bubble chart map with latitude and longitude coordinates in excel.

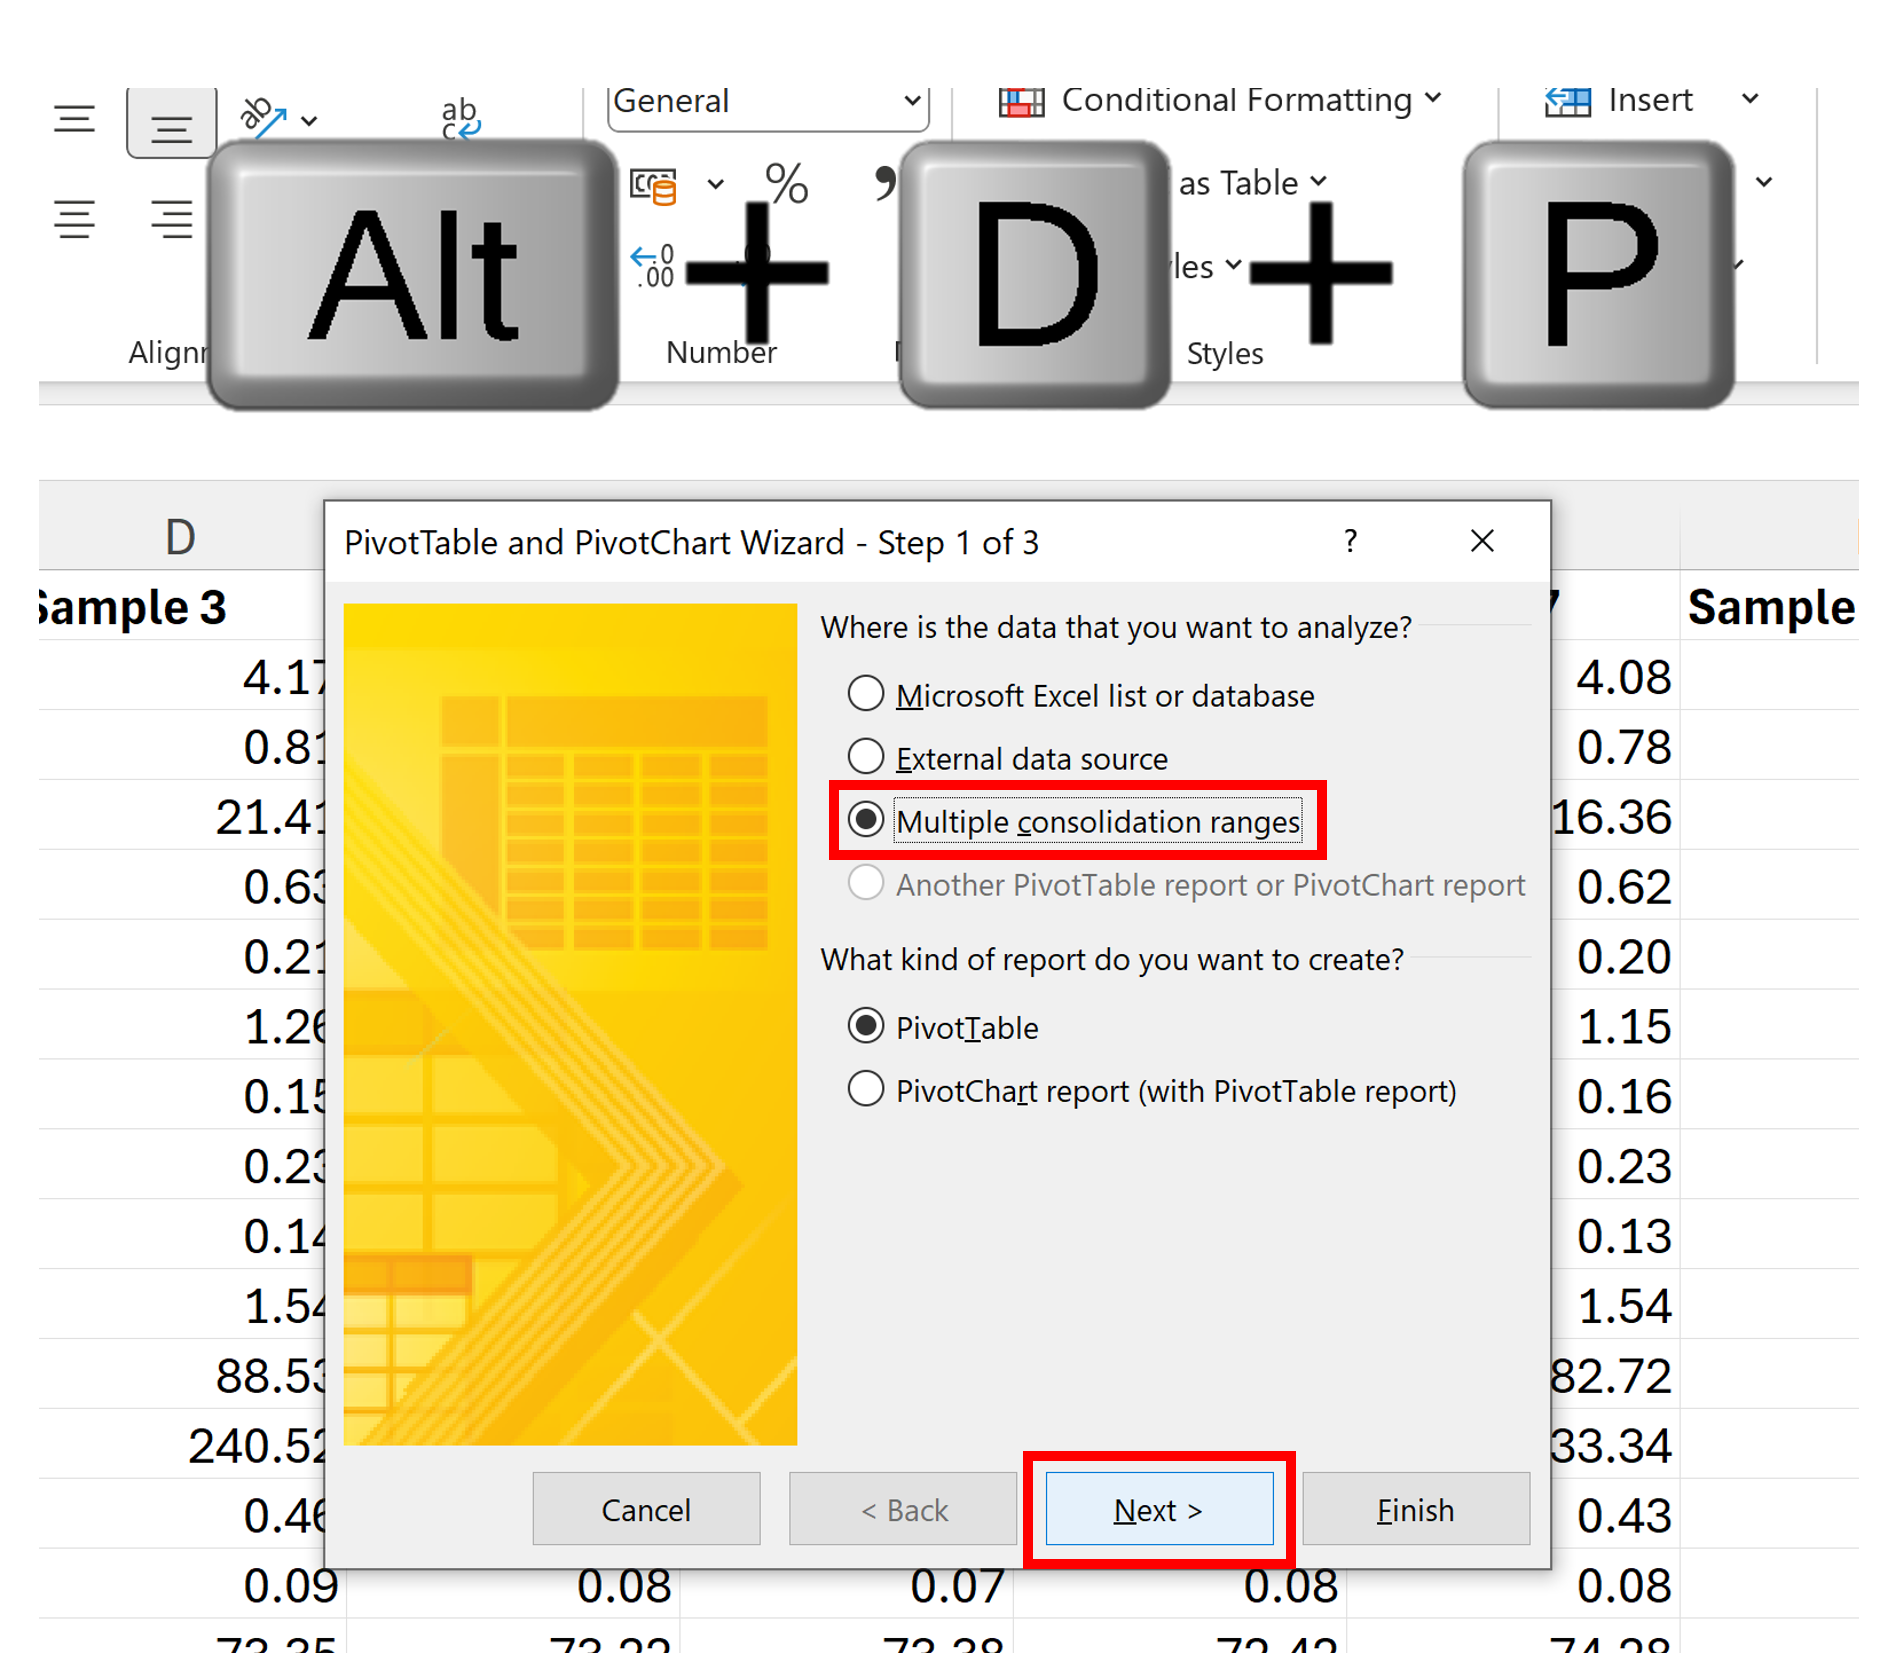
Rearrange a dataset using the old version of a Pivot Table

Combine multiple text files together in excel

Use Form Controls and VLOOKUP formula to make a dynamic chart in excel.

Converting a continuous count of days into excel formatted dates.

Convert wind directions in degrees into wind categories e.g. North, South, East and West using the CHOOSE and ROUND functions in excel.

There are some gaps in the wind direction data so the tables don’t line up. In order to line up the wind directions with the ozone concentrations an INDEX MATCH formula is used.

Use average hourly ozone concentrations to find out during which hour of the day the ozone concentrations are highest and during which hour of the day the ozone concentrations are lowest using an INDEX MATCH formula.

