The HYSPLIT model is a simple atmospheric transport model that anybody can access online for free.
HYSPLIT stands for Hybrid Single Particle Lagrangian Integrated Trajectory Model.
It was created by the USAs NOAA (National Oceanic & Atmospheric Administration) and Australia’s Bureau of Meteorology and is part of the Air Resources Laboratory.
The HYSPLIT model is a useful tool for atmospheric chemistry research. It can be used with meterological data to find out where the air mass at a particular location likely originally came from.
In this example I create a backwards trajectory at a location in northern Taiwan using three different heights going back 5 days.
Link to the HYSPLIT model: www.ready.noaa.gov/HYSPLIT.php
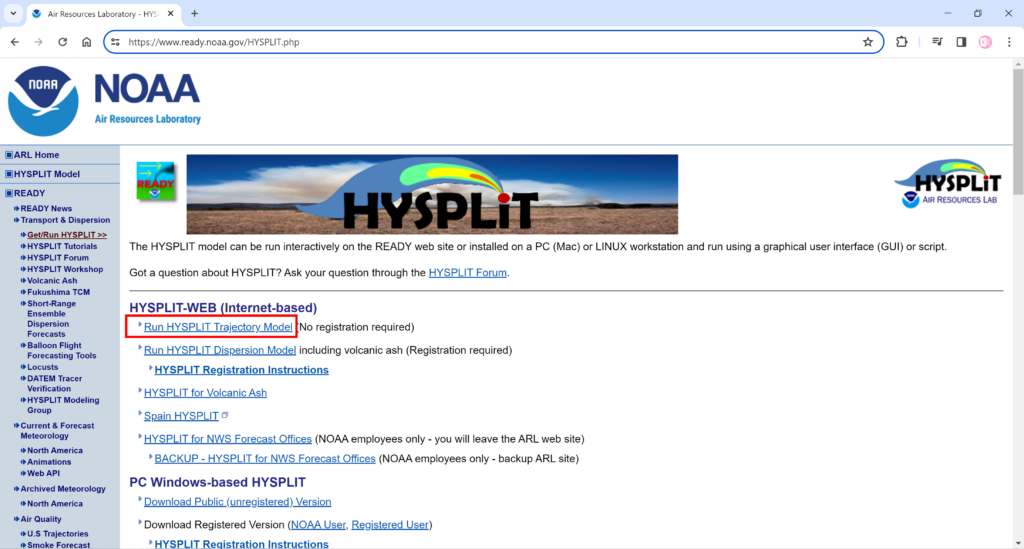
1. Start, by clicking on the link above to go to the first page. Here, select Run HYSPLIT Trajectory Model
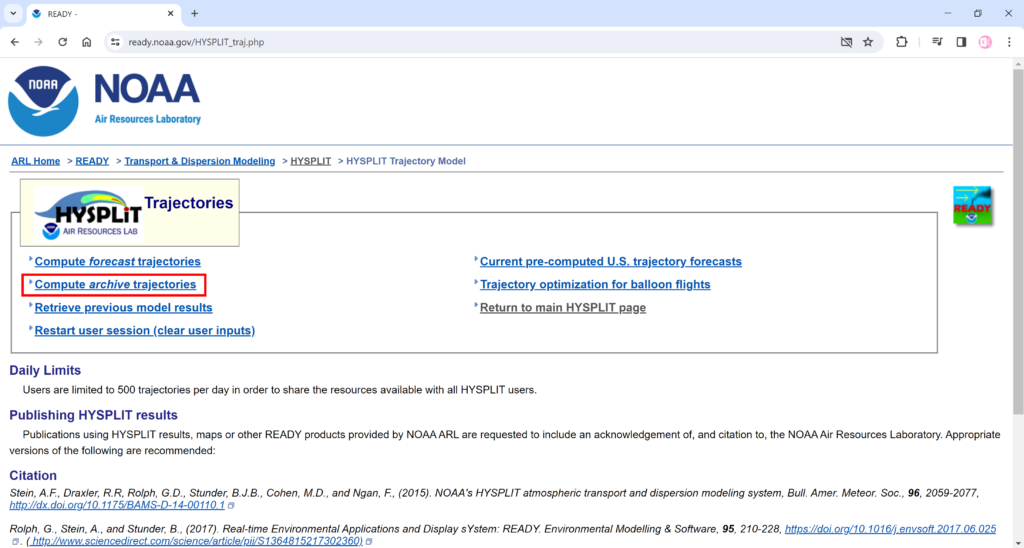
2. On the next page select Compute archive trajectories
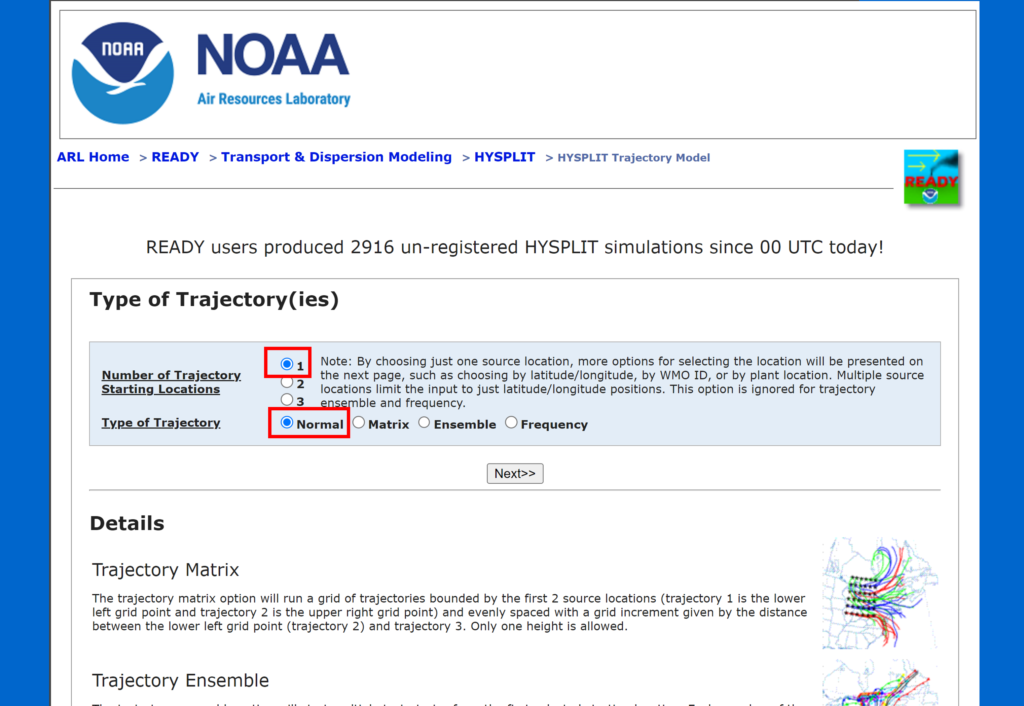
3. On the following page for Number of Trajectory Starting Locations select 1 and for Type of Trajectory select Normal. Then click Next.
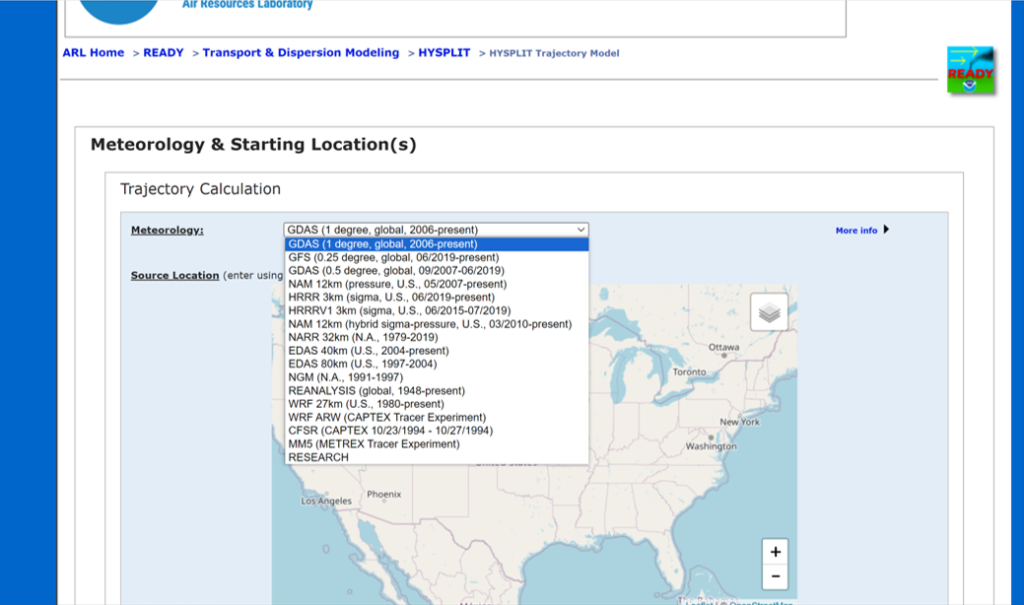
4. There are multiple different meteorological datasets that you can use. In this example, I’m just going to use the default one, GDAS (1 degree, global, 2006-present), which covers the whole global, at 1 degree resolution, going back to 2006.
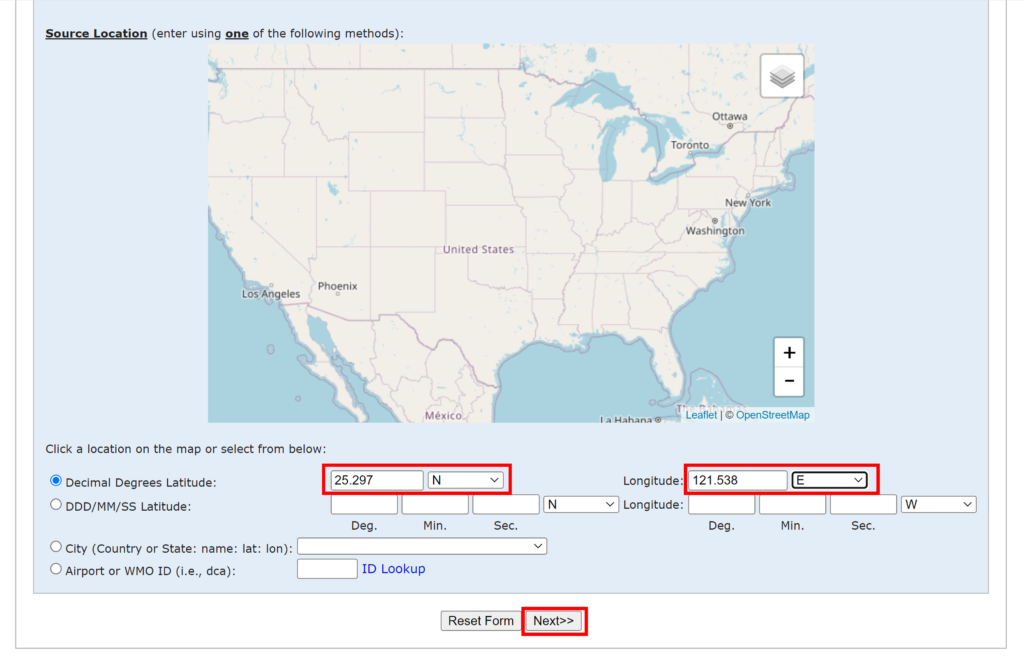
5. There are multiple different methods that you can use to pick the source location. I’m going to use Decimal Degrees Latitude & Longitude and I’m going to put in 25.297 N and 121.538 E, which is in northern Taiwan. Then click Next.
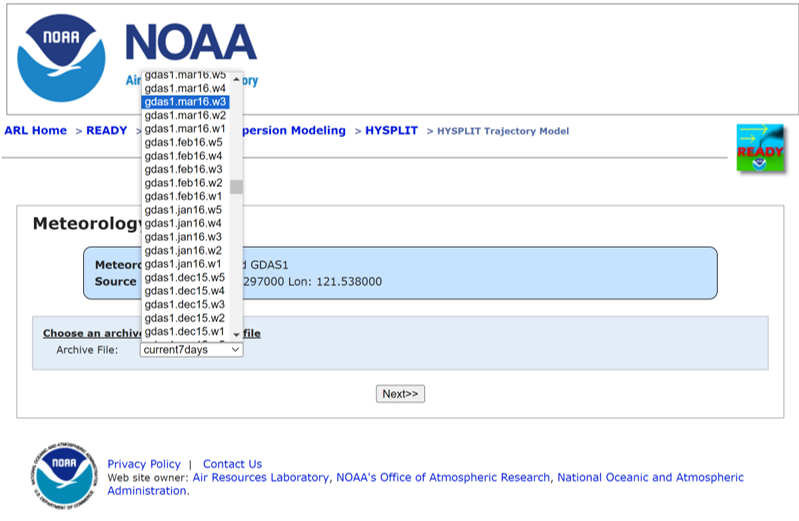
6. Next, select the meteorological file that you want to use. There is one for each week. In this example, I used gdas1.mar16.w3, i.e. March 2016 Week 3. Then click Next.
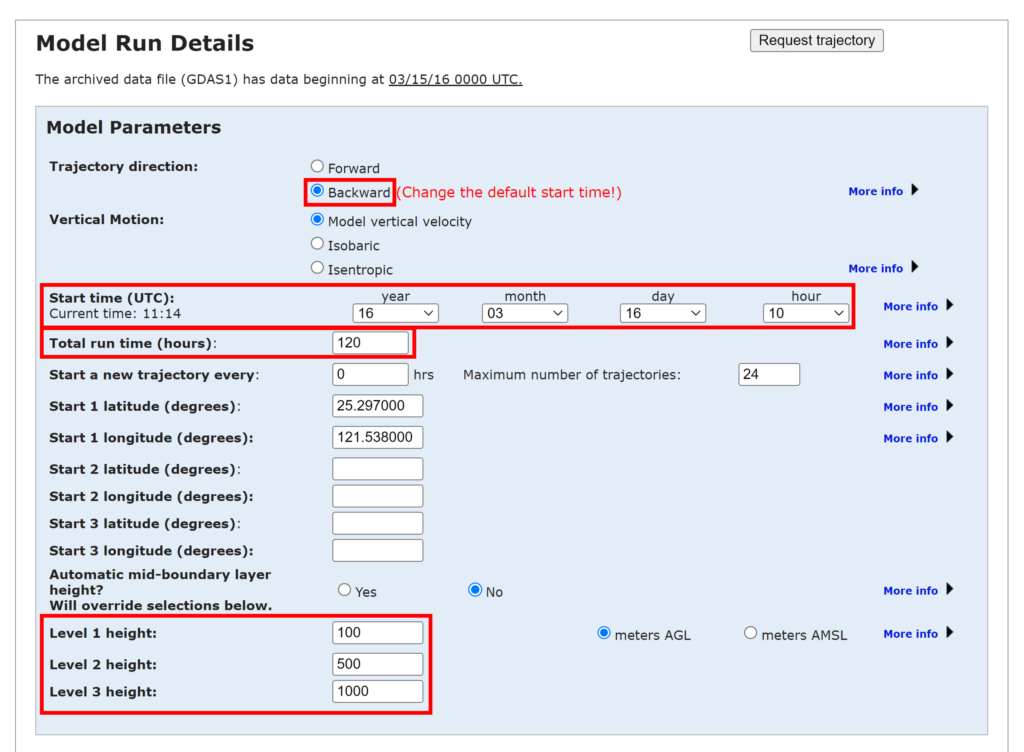
7. Change the Trajectory direction: to Backward, change the Start time (UTC): to 16th March 2016 at 10 am, and change the Total run time (hours): to 120 hours.
Also, change the Level Heights – Level 1: 100 meters, Level 2: 500 meters, Level 3: 1000 meters.
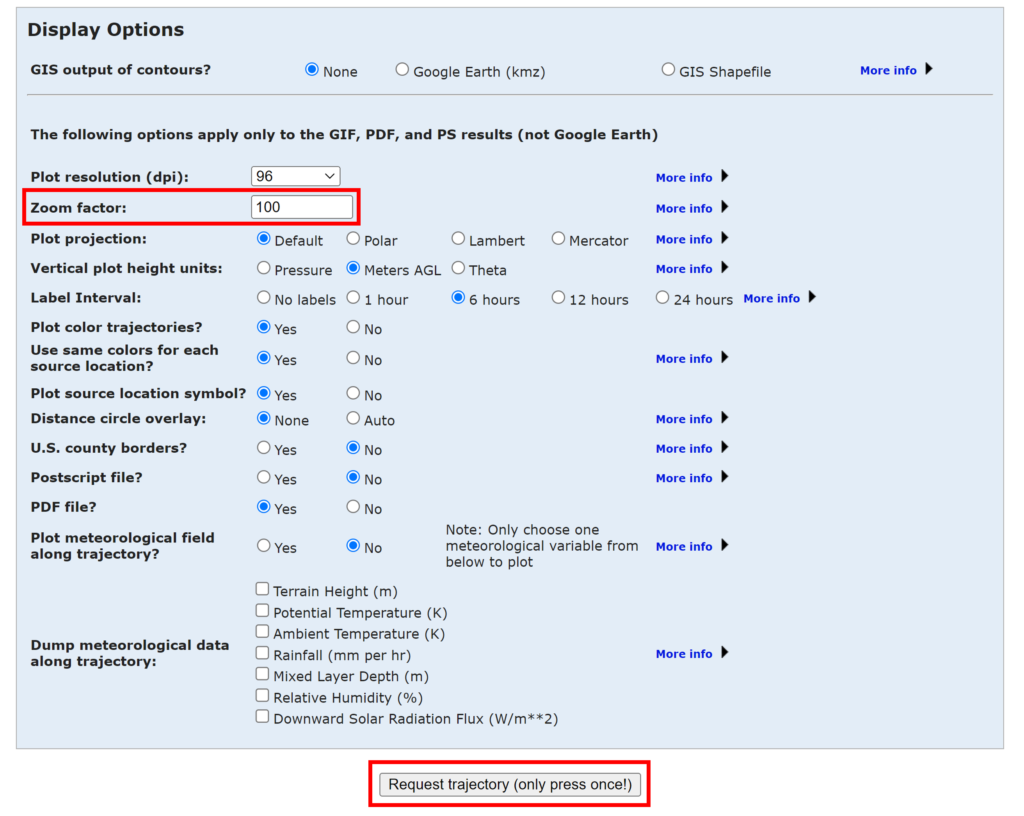
8. Change the Zoom factor: to 100. Leave all of the other settings as the default settings. Then click Request trajectory
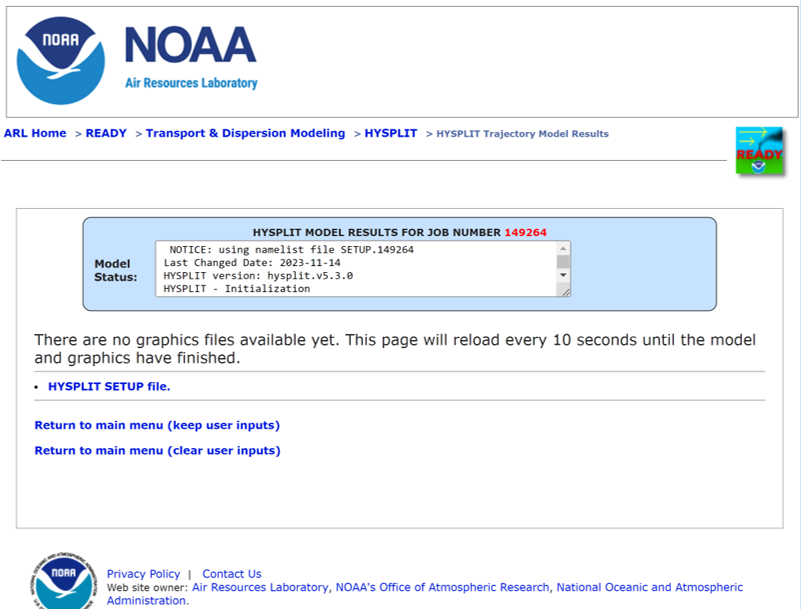
9. This takes you to a loading page, while it runs the model, it usually takes 10 seconds or 20 seconds, depending on how many other people are using it at the same time.
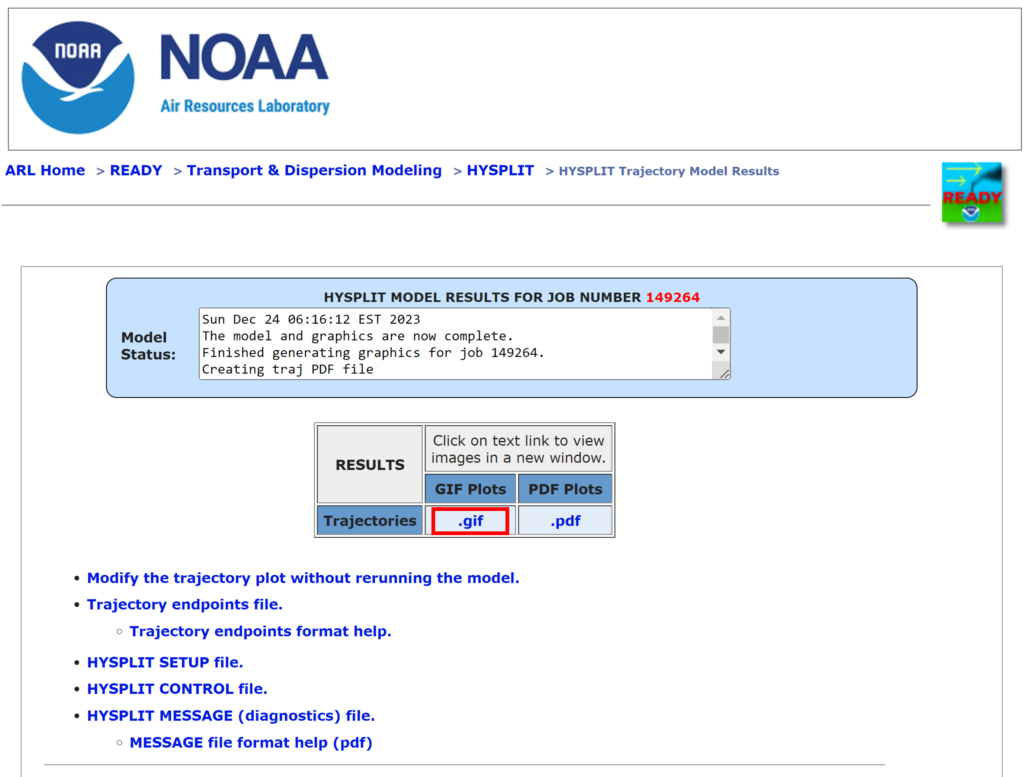
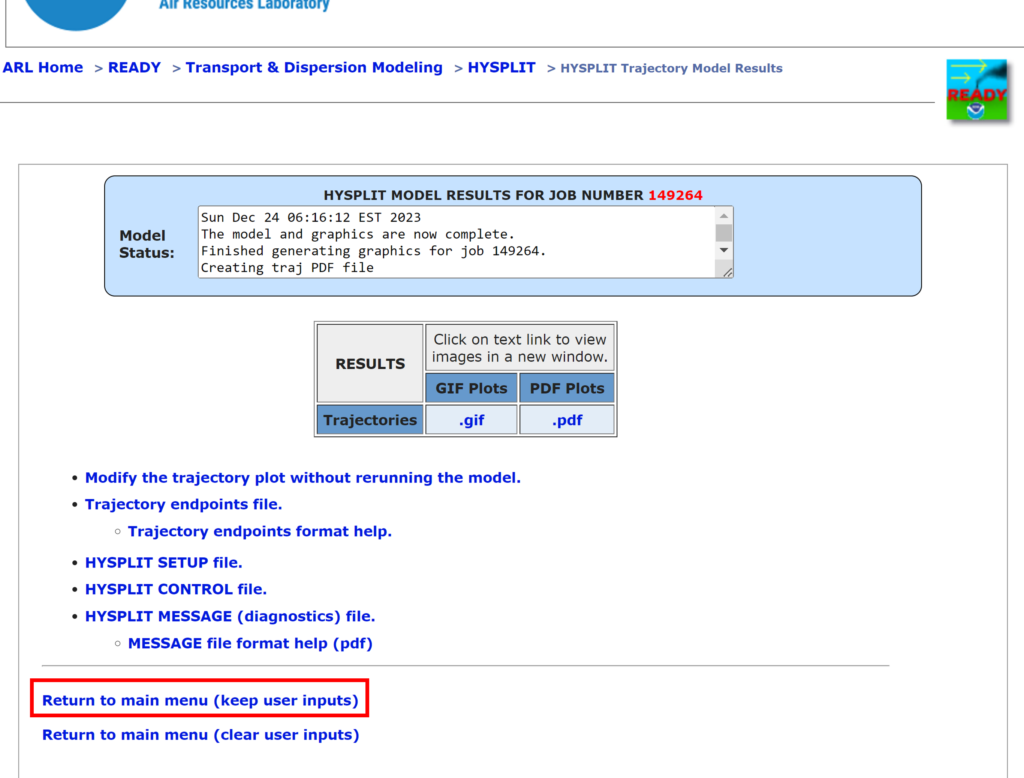
10. Once the model is done, the results page will load. You can then open your back trajectory map as a gif file.
In this example, we can see a map of Southeast Asia and the black star represents the location that I selected in northern Taiwan. The lines are the trajectories and they go back in time, five days, because we selected 120 hours. So where the lines end are where the air mass was 120 hours ago, and the line shows where the air travelled during that time. The green line shows the 1000 m trajectory, so the air at 1000 m above ground level, travelled over most of South-East Asia before it reached Taiwan. The blue line is the 500 m trajectory and the red line is the 100 m trajectory and we can see that these trajectories traveled only a short distance across China and that they traveled in almost the same way.
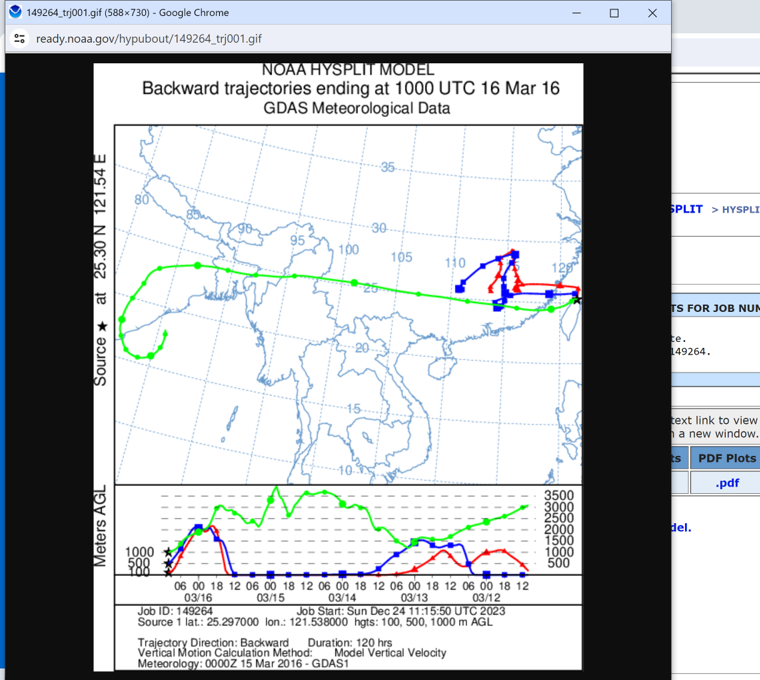
This is just a model output, not actual data, so these results needs to be taken with a pinch of salt, it’s what the model thinks probably happened, based on the meteorological data (i.e. wind speed, wind direction, etc) it’s using, but might not be what actually happened.
You can save this map as an image file by right clicking and selecting Save As.
Also, on the results page, you will see the option Return to main menu (keep user inputs). This is if you want to make lots of trajectories one after the other and you only want to change one small feature (e.g. the date or the time) in each of them. So it will allow you to keep all of the settings that you’ve already put in. So you don’t have to keep changing the settings over and over again.
For more information about what is the HYSPLIT model and what can the HYSPLIT model be used for: www.arl.noaa.gov/HYSPLIT_info.php
The HYSPLIT model is a complete system for computing simple air parcel trajectories, as well as complex transport, dispersion, chemical transformation, and deposition simulations. HYSPLIT continues to be one of the most extensively used atmospheric transport and dispersion models in the atmospheric sciences community. A common application is a back trajectory analysis to determine the origin of air masses and establish source-receptor relationships.

